


Canada’s political personalities
Canada’s political personalities
A different way to rank federal and provincial political parties

Every survey researcher likely has a favourite question they ask whenever they can. Here’s mine:
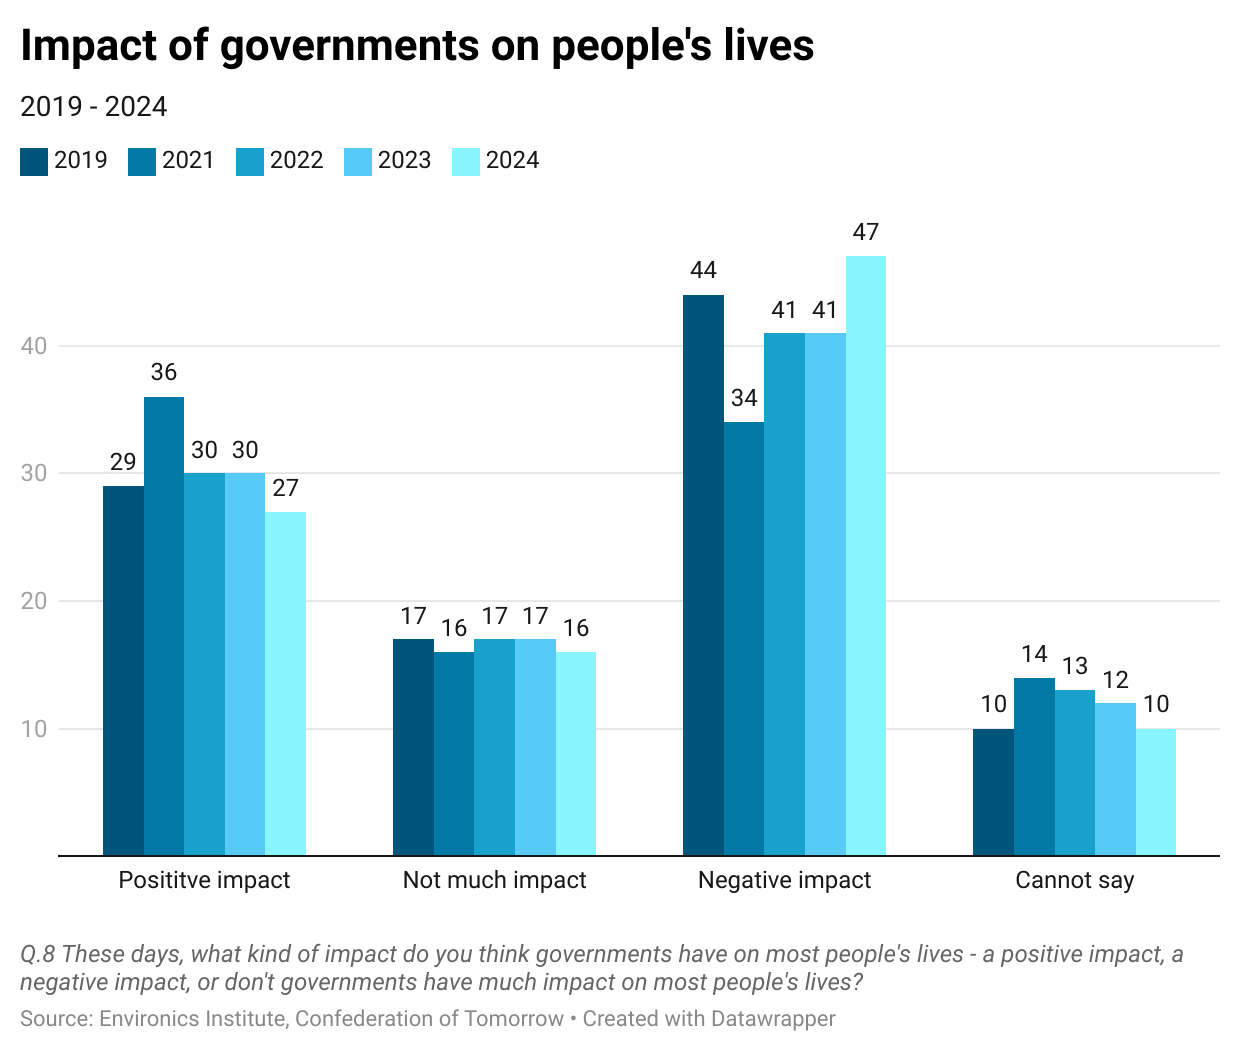
I launched this Substack with a post about whether the pandemic had affected how Canadians see the impact of government (if you missed it then, you can catch up here). As the chart shows, there was modest increase in 2021 in the proportion of Canadians who see governments as having a positive impact, but it didn’t last.
But that’s not the point of today’s post – this time, let’s take a look at how the supporters of different political parties answer this question. Here are the results based on federal voting intention.
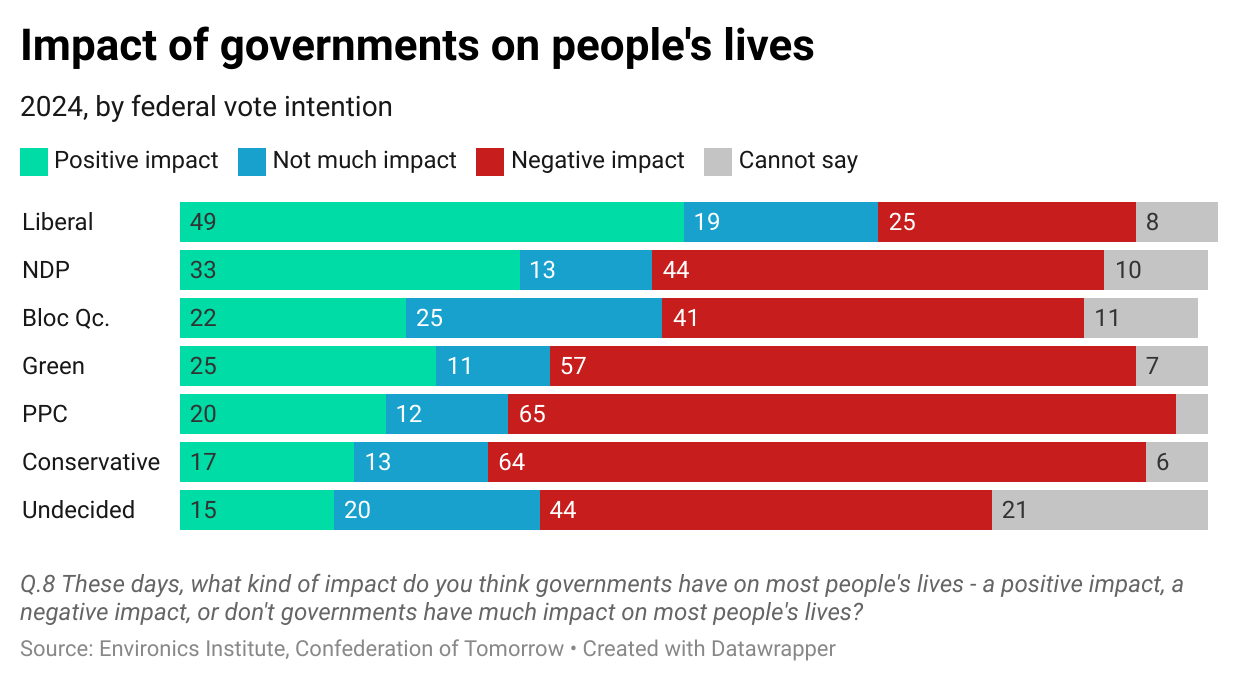
No surprise: Liberal Party supporters are almost three times as likely as Conservative Party supporters to say that governments have a positive impact on most people’s lives. NDP supporters are in-between. There is very little distance between Conservative Party, People’s Party and Green Party supporters on this question (though the sample sizes for the PPC and Greens are much smaller – see below for details).
Perhaps the most important result here – in terms of any eventual election – is that undecided voters are the least likely to say that governments have a positive impact. There is a natural inclination to assume that undecided voters are simply people who can’t make up their minds – they are torn between Party A and Party B (as, for example, blue Liberals or red Tories might be). But they are actually more distinct than that: they are less engaged than average, and less impressed with the political system overall. If they do vote, they are more predisposed to opt for a party that shares their sense of political alienation.
The finding that federal Liberal Party supporters are more likely than any other group to see governments as a positive force might be explained by the fact that they currently hold office. But a look at the results by provincial vote intention shows that things are not quite that simple.
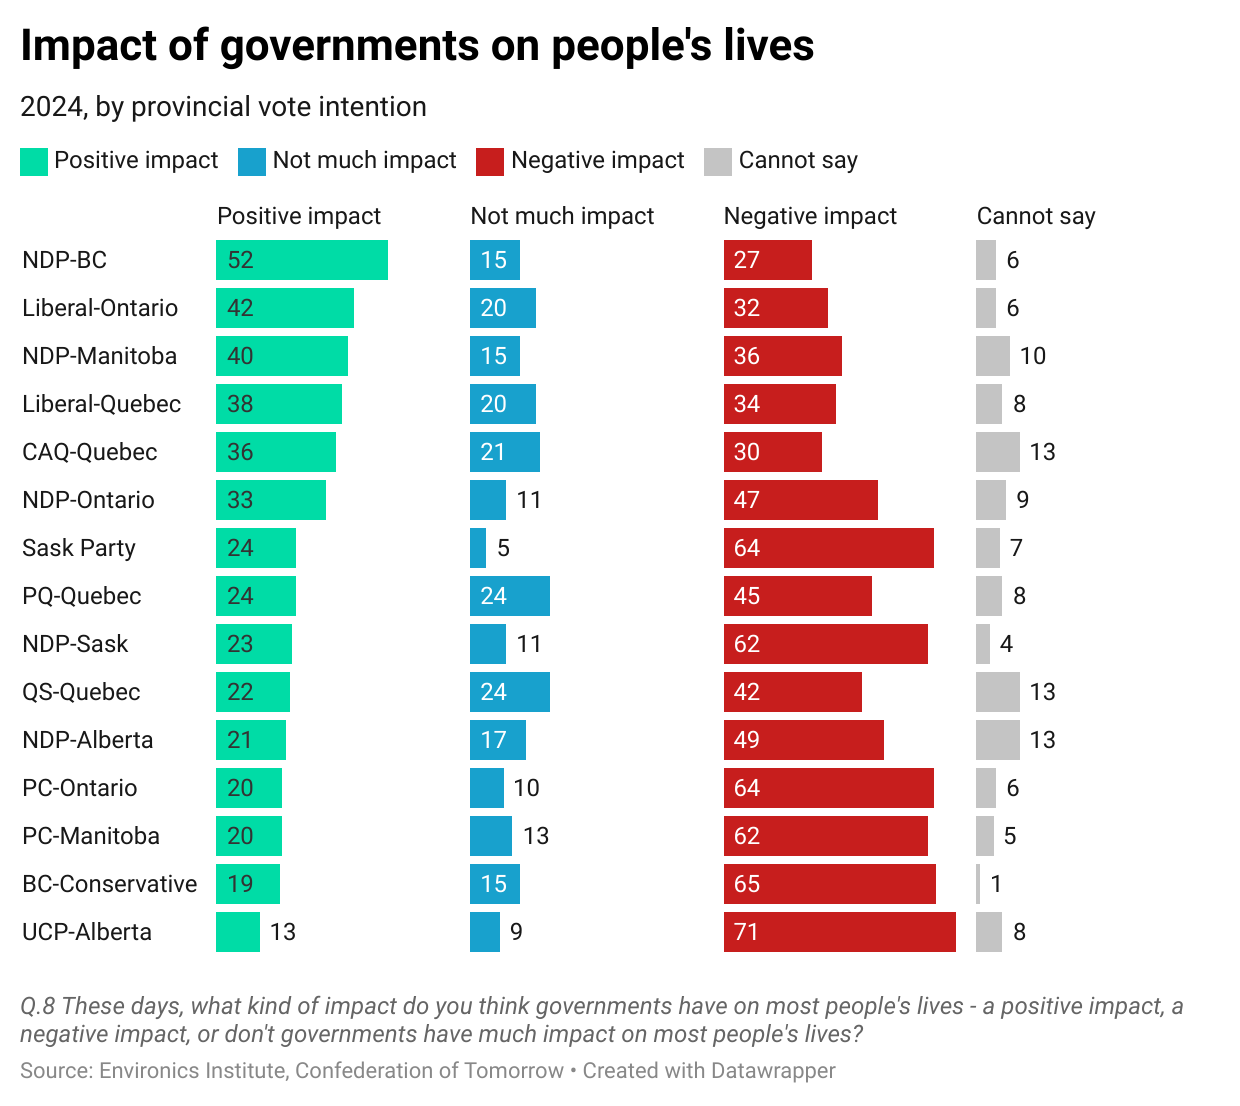
The choice of parties to include in this chart is dictated by sample sizes (see note below). Some of these samples are decent, but some are very small and should be treated with caution (this is just a blog post to spark some conversation, not an election forecasting model). Some were too small to include, including BC United and the provincial Conservative Party in Quebec (and any provincial party in Atlantic Canada).
With that caveat in mind, here are a few observations:
The two parties at the opposite ends of the chart are the BC-NDP and the Alberta UCP – which form government in neighbouring Western provinces.
Supporters of the two provincial Liberal parties included in the chart (in Quebec and Ontario) are among the most likely to say that governments have a positive impact on most people’s lives, even though neither currently forms government.
On this question, there is almost no difference between supporters of the Saskatchewan Party and the Saskatchewan NDP.
Supporters of the Ontario PC Party are twice as likely as those who support the CAQ in Quebec to say that governments have a negative impact – even though both are nominally centre-right governing parties from Central Canada.
Let’s take a closer look at how things line up when we put the federal and provincial parties together, showing first the proportions of their supporters who say governments have a positive impact on most people’s lives.
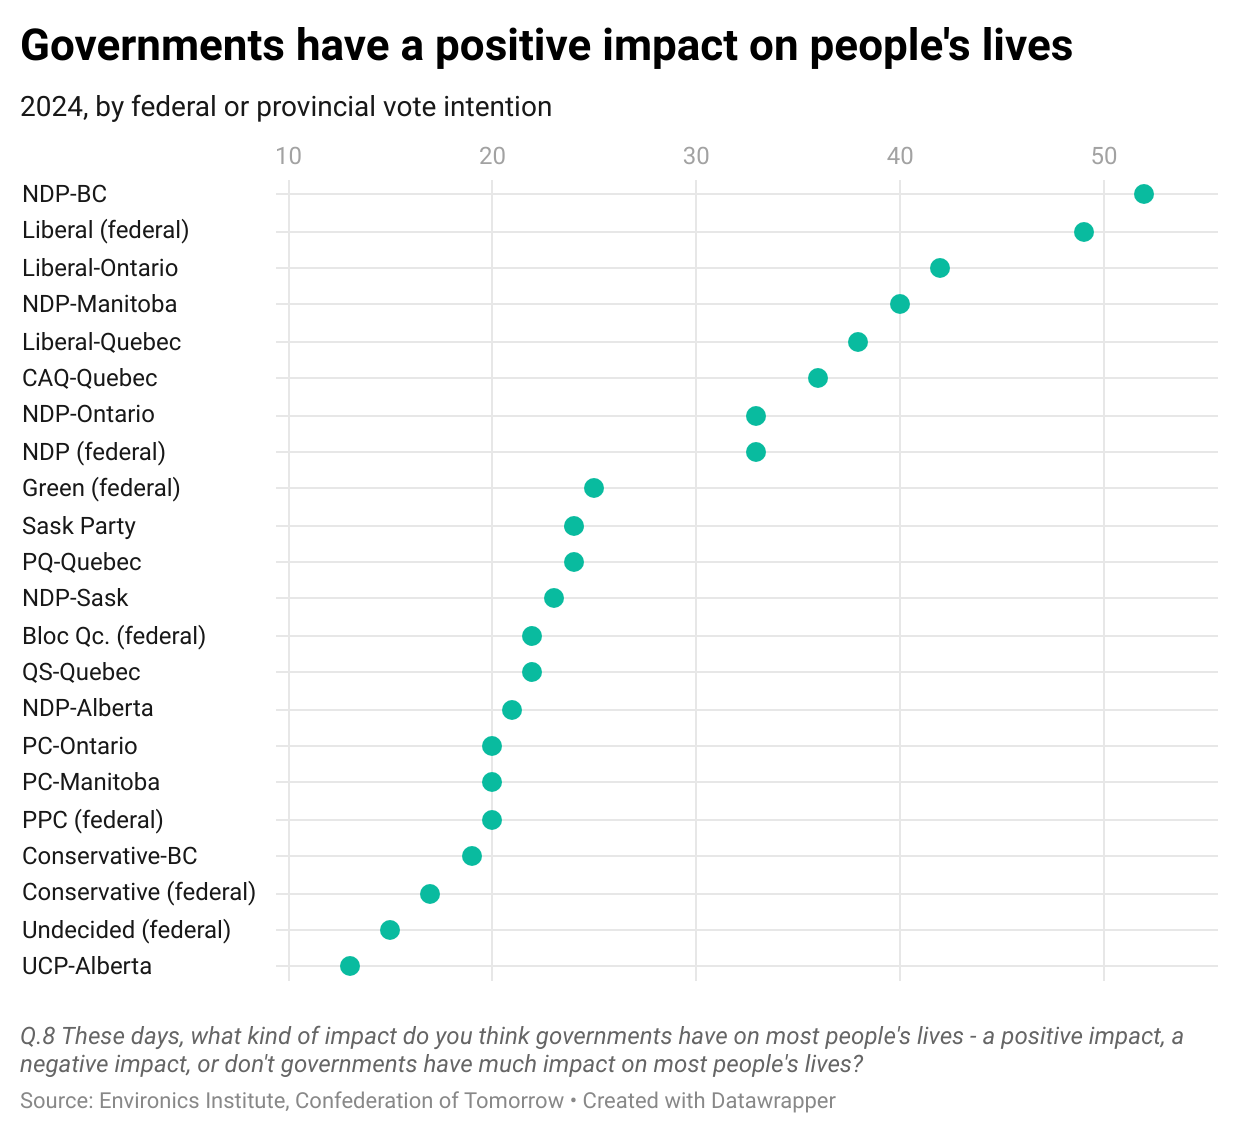
Based on this chart, it’s fairly clear why the federal prime minister and the premier of B.C. tend to understand one another (joined perhaps more recently by the new premier of Manitoba). But the supporters of the other NDP parties occupy a middle group, as far from the top of the chart as they are from the bottom. Maybe this is simply because they all find themselves in opposition. But my hunch is this also reflects the populist heritage of Canada’s left-of-centre party, born as much from the farmers’ protest parties as from the labour movement.
Here are the proportions who say that governments’ impact is negative.
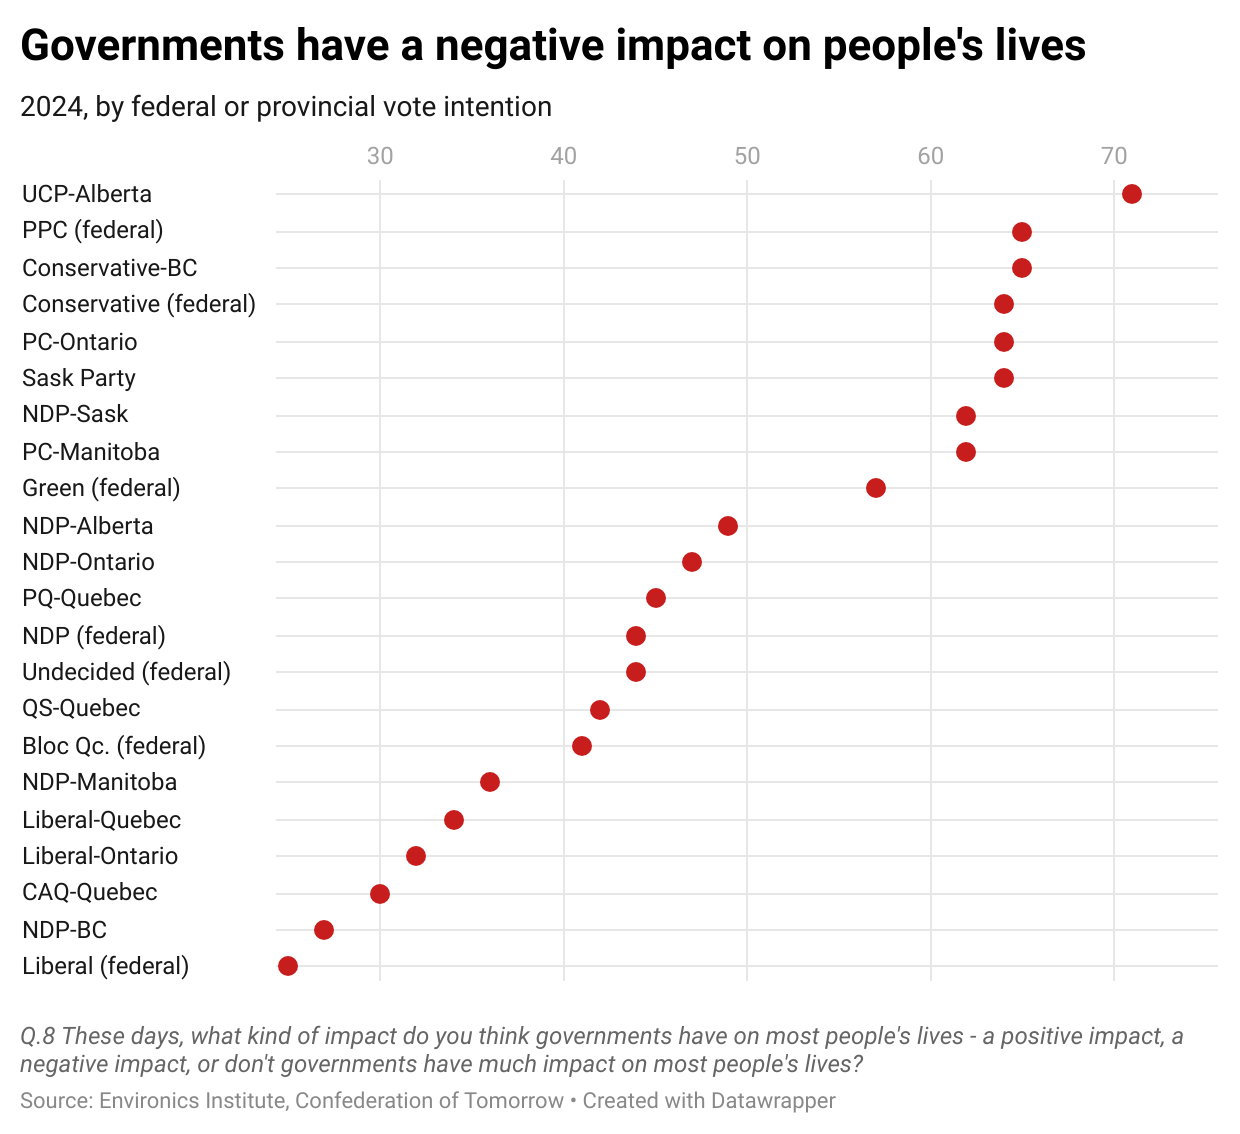
Roughly two in three supporters of the governing parties in Alberta, Ontario and Saskatchewan think that governments have a negative impact on most peoples’ lives. The proportions of the supporters of the governing parties in Quebec and B.C., and federally, who share that view is much smaller. Looking at this pattern, I wonder: maybe the current debate we are having about the carbon tax isn’t really about the tax itself, but about whether government policies in general tend to make people’s lives better or worse.
Should the party in power in Ottawa change in 2025, this dynamic will be upended. It will be the governments in Quebec and B.C.* that risk feeling out of step, as the remaining governing parties whose supporters are not suspicious of government. These two provincial governments, however, have little history of working together as allies, so each risks feeling somewhat isolated.
* Depending, of course, on the outcome of the B.C. provincial election later this year, which is hardly a foregone conclusion.
This post features data from the 2024 Confederation of Tomorrow Survey of Canadians. The author is solely responsible for any errors in presentation or interpretation.
The Confederation of Tomorrow surveys give voice to Canadians about the major issues shaping the future of the federation and their political communities. They are conducted annually by an association of the country’s leading public policy and socioeconomic research organizations: the Environics Institute for Survey Research, the Centre of Excellence on the Canadian Federation, the Canada West Foundation, the Centre D’Analyse Politique – Constitution et Fédéralisme, the Brian Mulroney Institute of Government and the First Nations Financial Management Board.
The 2024 study consists of a survey of 6,036 adults, conducted between January 13 and April 13, 2024 (82% of the responses were collected between January 17 and February 1); 94% of the responses were collected online. The remaining responses were collected by telephone from respondents living in the North or on First Nations reserves.
Here are the unweighted sample sizes for each group of party supporters.
Federal: Liberal = 1,429; Conservative = 1,679; NDP = 1,014; Bloc Québécois = 411; Green = 307; PPC = 162; undecided = 1,012.
Quebec: CAQ = 324; PQ = 372; Liberal = 267; QS = 179.
Ontario: PC = 246; NDP = 168; Liberal = 263.
Manitoba: NDP = 121; PC = 117.
Saskatchewan: Saskatchewan Party = 157; NDP = 117.
Alberta: UCP = 213; NDP = 176.
BC: NDP = 183; BC Conservative = 102.
Interesting cross tabulations, not as intuitive as I would have expected.