What’s the opposite of a bell curve?
On the issue of same-sex marriage, polarization is fading away
When I write my own survey questions, I don’t tend to use numbered scales – it’s just not my favourite format. But sometimes we use standard questions that others have developed. Here’s one that uses a scale from one to 10, where one means “strongly disapprove” and 10 means “strongly approve.” In this case, I think the scale is useful because it helps to illustrate a few important points.
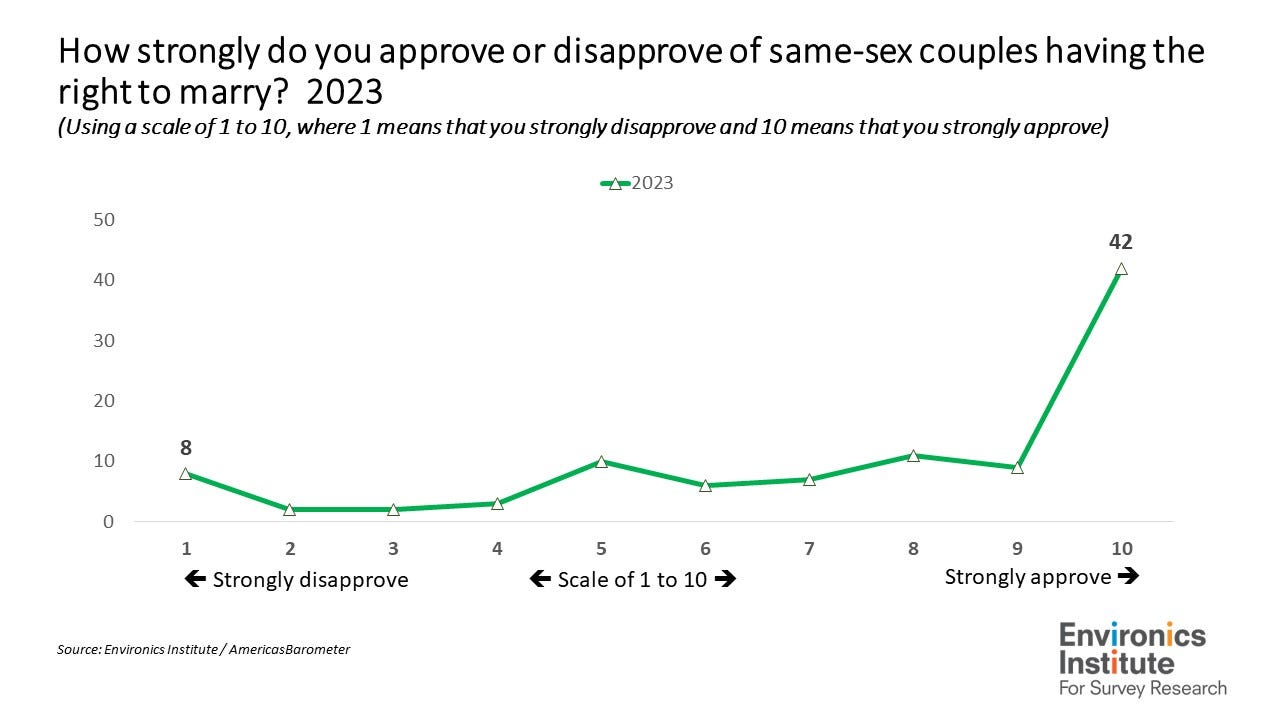
On the issue of same-sex marriage, the most common answer in Canada today (by far) is “10” – the strongest level of approval. One in two (51%) are either a nine or a 10, and 63 percent place themselves at an eight or higher. This is not what the statisticians would call a “normal distribution.” This is what strong support looks like.
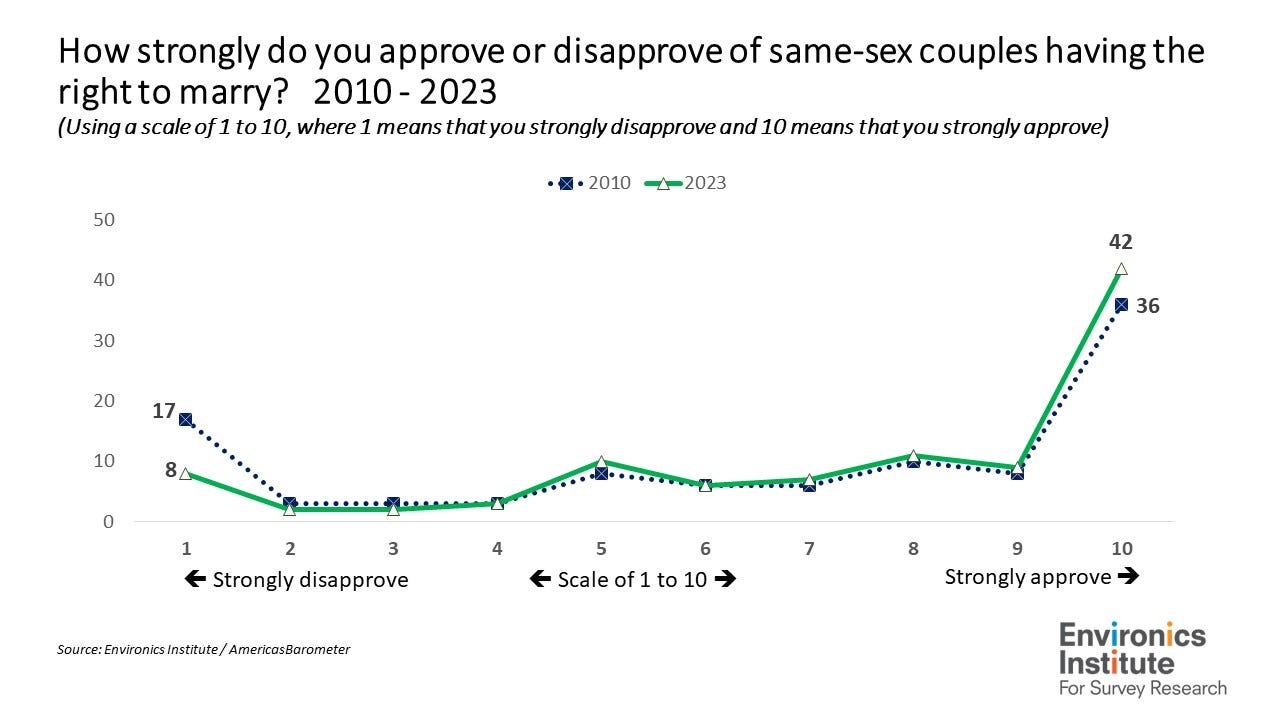
Here’s a comparison to the answers from 2010.
Already in 2010, more than one in two Canadians placed themselves at an eight or higher. But compared to 2010, half as many people today express the strongest possible disapproval (a “one” on the scale). Similarly, since 2010 the proportion placing themselves at a three or lower on the scale has fallen from 24 percent to 11 percent.
To a very limited extent, the issue is still polarizing because the curve bends upwards at both ends. A good number of people have strong views on the issue, including some who strongly disapprove. But this polarization is fading away: the lowest possible score of “one” used to be the second-most common response after “10”; now it’s the fifth-most common.
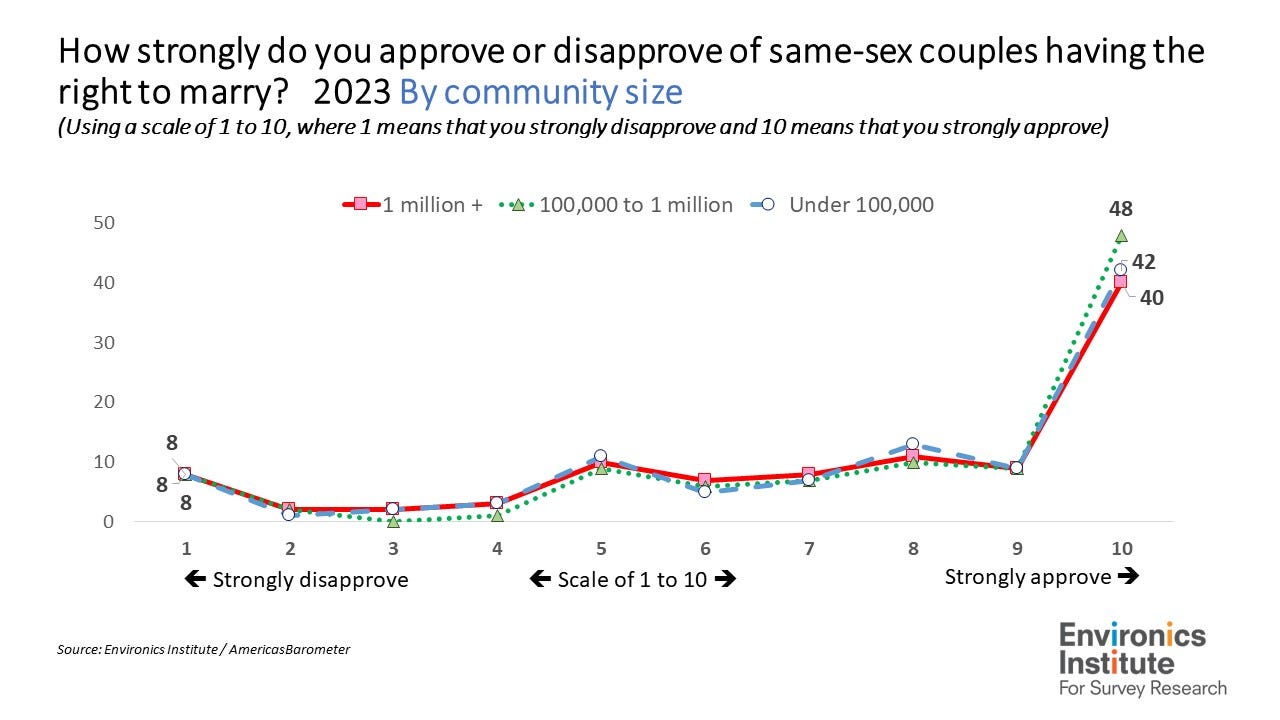
When it comes to differences between population groups, there are a few surprises. Remember how big the cleavage is supposed to be these days between urban and rural Canada? See if you can spot that cleavage here.
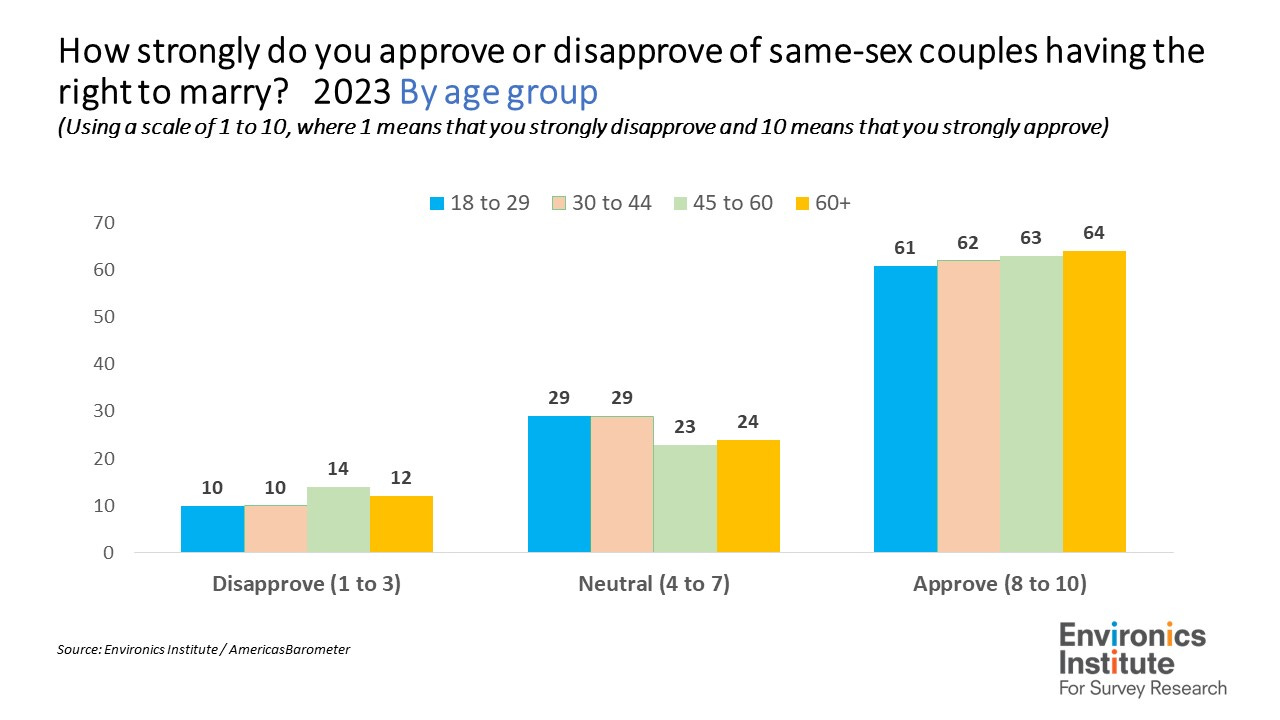
No, I don’t see it either. What about young versus old? (I am going to switch to bar charts now, with three groups of responses, to make things a little clearer.)
Young adults in Canada, their middle-aged parents, and their grandparents are now equally likely to approve of same-sex couples having the right to marry. Social change in Canada has worked its way through the generations.
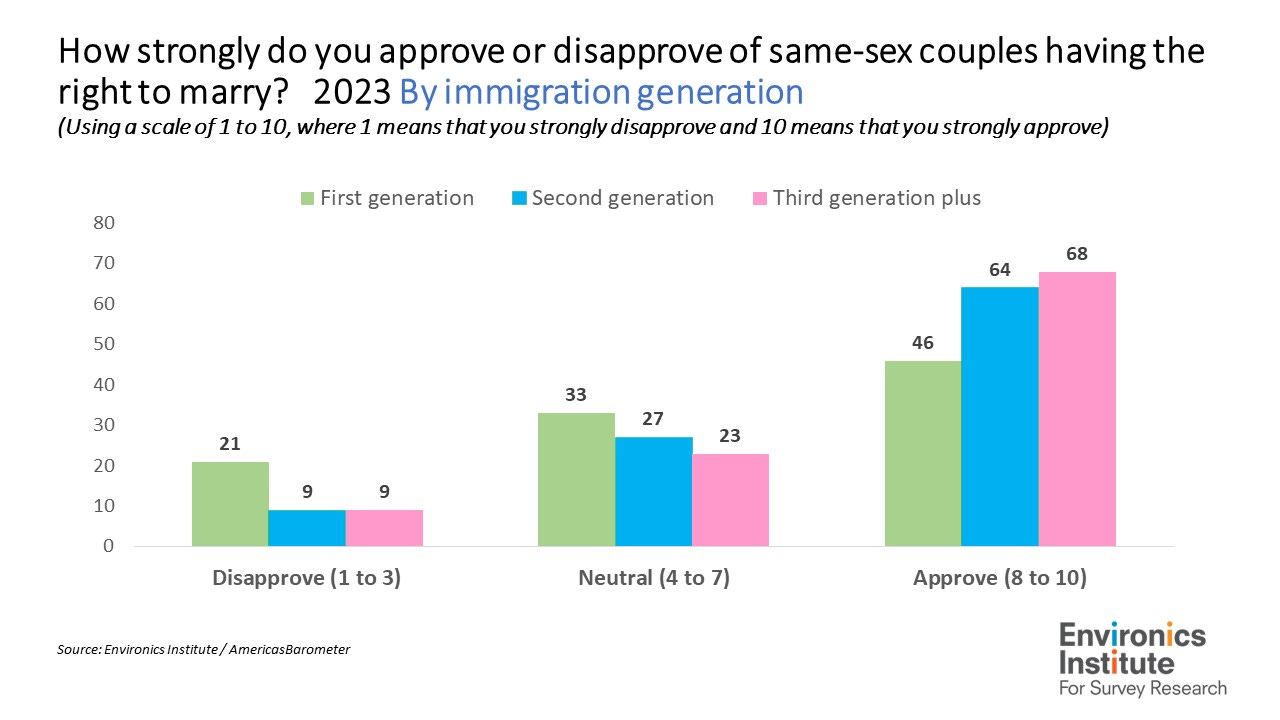
But some differences remain. One is by immigration background: first-generation immigrants are more likely to disapprove of same-sex marriage than are second-generation immigrants (those with at least one parent born outside of Canada) and third-generation-plus Canadians (those born in Canada to Canadian-born parents).
To the extent that there is some reluctance to approve of same-sex marriage, then, it is not among older Canadians or Canadians living in smaller towns, but among newcomers. But it’s notable that the opinions of second-generation immigrants look more like those of the third-generation-plus group and less like those of first-generation immigrants. It is natural to find some value differences among those coming to Canada from other countries compared to those who are already here. But this difference is more or less absent among the children of immigrants who have grown up in Canada.
Finally, there are political differences: not surprisingly, those who place themselves on the left of the political spectrum are more likely to approve of same-sex couples having the right to marry than those in the centre or on the right.
But the more important observation is that at least one in two on either side of the political spectrum approves; and even among those on the right, only one in five disapproves. The same pattern holds if we look at opinions among supporters of the main federal political parties. Certainly, approval is higher among New Democrats (77%) and Liberals (72%) than among Conservatives (52%). But only 19 percent of Conservative Party supporters disapprove of same-sex marriage.
In other words, among those on the right and among those who intend to vote Conservative, approval of same-sex marriage outweighs disapproval by a significant margin.
To see why this is worth emphasizing, we can compare this to results from the United States. We don’t have US data for 2023 yet, so we have to go back to the 2017 survey. In that year, Americans on the right were much more likely to disapprove of same-sex marriage than to approve of it (by a margin of 48% to 27%). And disapproval of same-sex marriage was three times higher among right-leaning Americans (48%) than among right-leaning Canadians (16%).
On this issue, there is more distance between Canadian and American conservatives than there is between conservatives and liberals within Canada.
The findings featured in this post are from the Canadian portion of the 2023 AmericasBarometer. The AmericasBarometer is a biennial comparative survey of democratic values and behaviours that covers countries in North, Central and South America, as well as a significant number of countries in the Caribbean (the 2023 survey covers 25 countries). The project is led by the Latin American Public Opinion Project (LAPOP) at Vanderbilt University.
The survey is the most comprehensive source of information about support for democracy in Canada. Follow the Environics Institute to catch more reports from this survey.
The 2023 AmericasBarometer in Canada survey was conducted by the Environics Institute for Survey Research, in partnership with LAPOP at Vanderbilt University. It was conducted online with a representative sample of 2,500 Canadians (aged 18 and over) between July 20 and August 4, 2023. The author is solely responsible for any errors of presentation or interpretation.
What is the Environics Institute for Survey Research? Find out by clicking here.
Follow us on other platforms:
· Twitter: @Environics_Inst or @parkinac
· Instagram and Threads: environics.institute


