


Is this what a recession feels like?
Putting today's economic outlook in historical context

Just how gloomy are Canadians feeling about the economy these days?
If you caught the latest bulletin from the Survey on Employment and Skills, you’ll have seen the answer. First, there’s the problem posed by the tariffs. Over four in five Canadians (83%) are worried about the impact that U.S. tariffs might have on the Canadian economy; and one in two employed Canadians (47%) are worried about the impact that the tariffs might have on their own job.
Then there is the increasing proportion who feel that it’s a bad time, and not a good time, to find a job in the community where they live, continuing a discouraging trend I wrote about last fall.
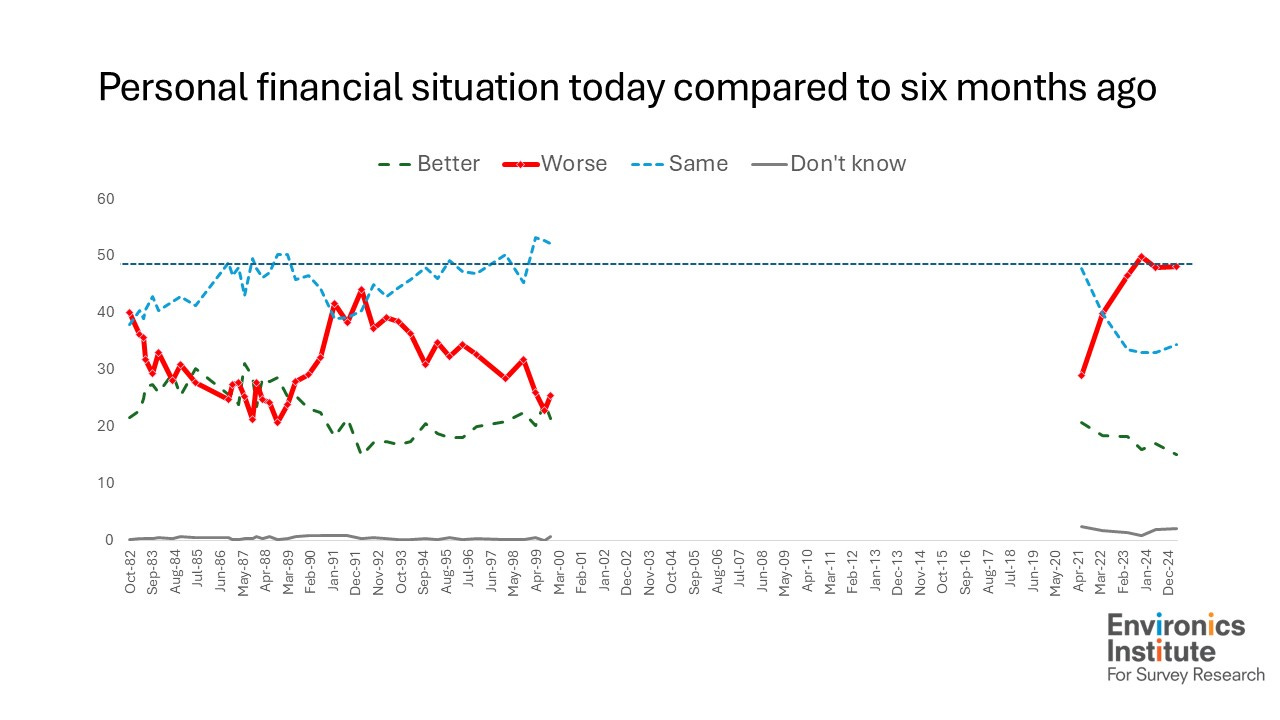
But today I want to focus on two questions about one’s personal financial situation – the first looking backwards and the second looking ahead. Here’s how the results looked in the most recent survey, completed this spring.
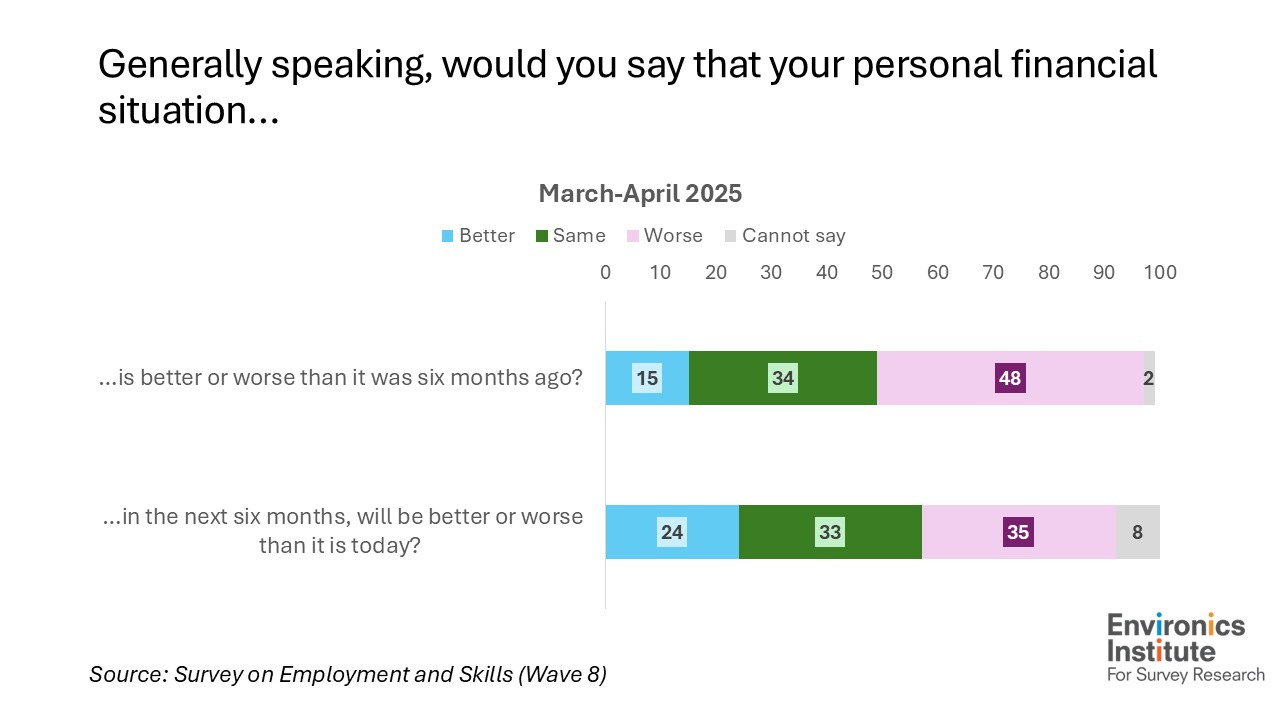
How should we interpret this? Not many people think their financial situation is on the upswing, but not everyone is pessimistic either. How worrying is it that 48 percent say their situation is worse than it was six months ago, or that 35 percent expect it to be worse six months from now?
Is 35 percent a lot?
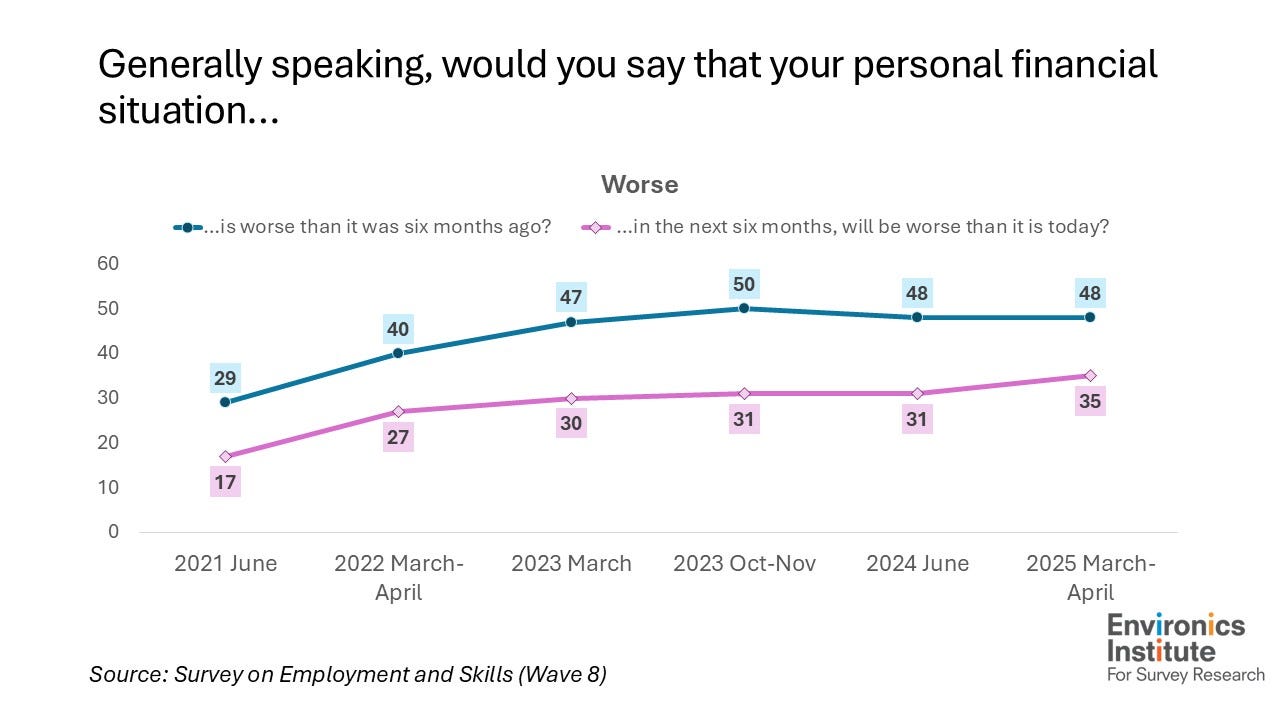
The first thing we can add is that the outlook has been getting more negative over the past few years, as we came out of the first year or so of the pandemic. This was the trend highlighted in our recent bulletin.
But we can go further than this, because the question is one that was previously used by Environics in its Focus Canada surveys, beginning in the early 1980s. That means we can compare the situation today with how things looked 30 and even 40 years ago.
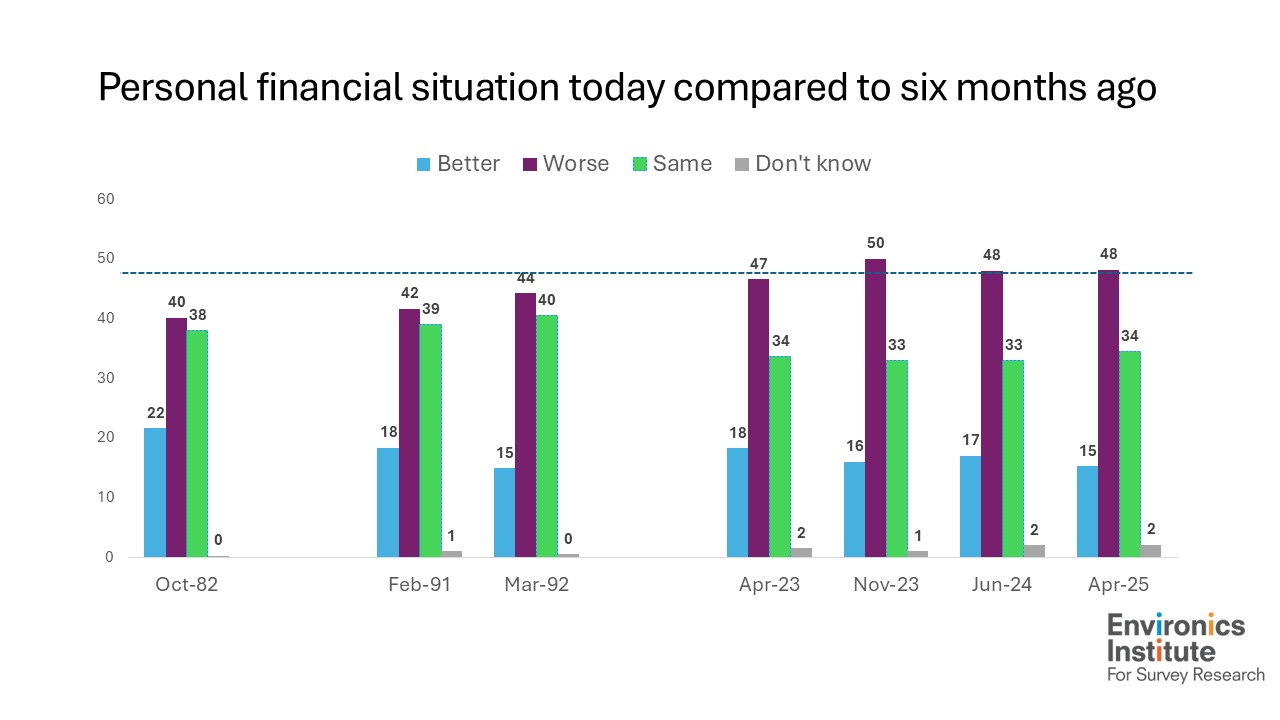
Here’s how answers to the first question today compare to those of earlier periods when there was a downturn in the economy.
(Charting the full time series is challenging, especially if we use true time-series spacing on the horizontal axis. I will include my best attempts at the end of this article as an appendix, for readers who are interested.)
Unfortunately, this question was dropped at the start of the 2000s – so we don’t have data from the period of the global financial crisis, for instance. We can’t say for sure that people’s sense of their financial situation wouldn’t have been worse then than it is today.
But we can say that Canadians today are more likely than they were during the early 1980s and early 1990s – periods of economic recession – to say their financial situation has gotten worse over the past six months.
Now here’s the same comparison for the second question.
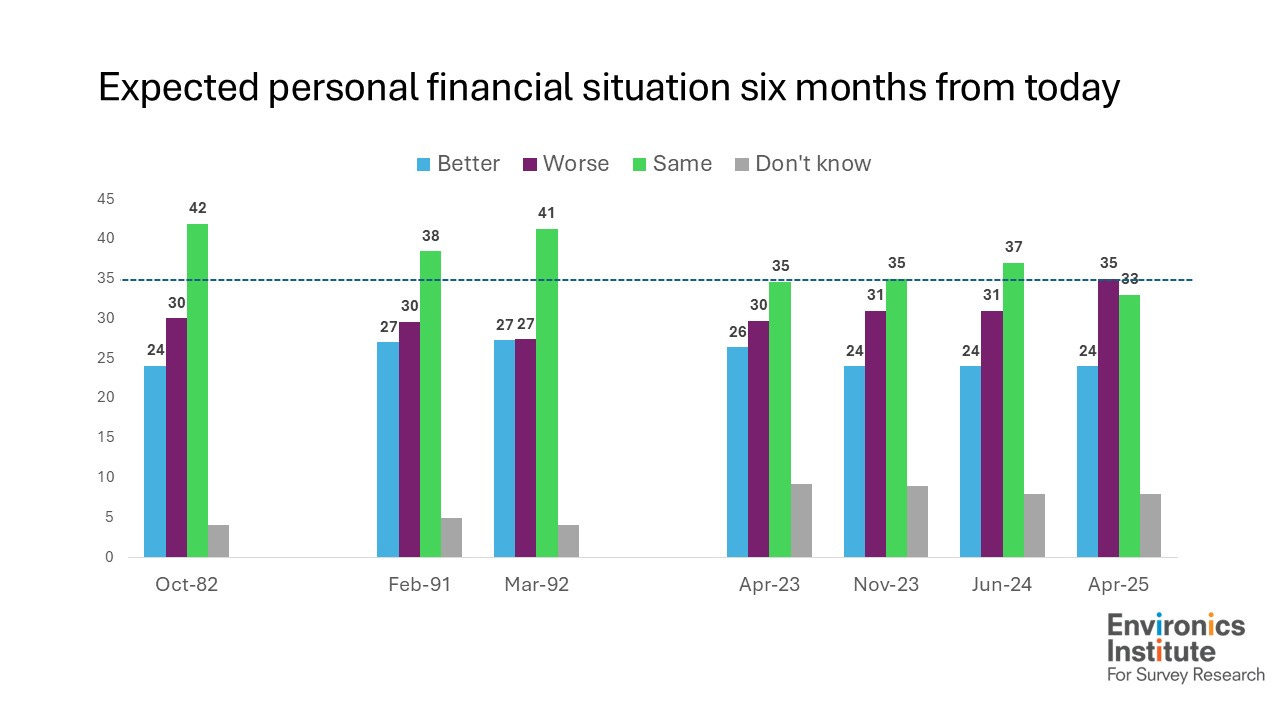
The overall pattern is the same: even during the recessions of the early 1980s and early 1990s, Canadians were not quite as pessimistic as they are today about the direction in which their personal finances are headed.
One other way to capture the situation is to look at how often the proportion who expect their financial situation to get worse exceeds the proportion who expect it to get better – that is, when the red line moves above the green line on the second appendix chart below. This occurs only three times prior to 2000 (the three I have chosen for the chart above): at the very start of the series in 1982, and then again in 1991 and 1992.1 But it has occurred several times since 2022.
And so yes, when we add this historical context, we can say that 35 percent is “a lot.”
In flagging this, I have two purposes. One is just to showcase again the virtues of repeating questions regularly over long periods of time. Even if a time series in interrupted, it is worth revisiting it when we can. This is one of the many contributions of the Survey on Employment and Skills.
But the second is to point to the need to focus on a response. Now would be a good time to reassure Canadians that there are policies coming to address the economic pressures they are experiencing. We have seen already some improvement in how Canadians feel about the overall direction of the country in the weeks following the April federal election. Time will tell if the actions that now follow will be sufficient to boost the economic mood in the country as well.
The post features data from surveys conducted by the Environics Institute for Survey Research, as well as earlier data from the Environics Focus Canada surveys. The most recent data are from the Survey on Employment and Skills. This survey is conducted by the Environics Institute for Survey Research, in partnership with the Diversity Institute at Toronto Metropolitan University and the Future Skills Centre. More information about the survey is available in the most recent survey bulletin.
The author is solely responsible for any errors of presentation or interpretation.
The Survey on Employment and Skills is funded primarily by the Government of Canada’s Future Skills Centre / Le sondage sur l’emploi et les compétences est financé principalement par le Centre des Compétences futures du gouvernement du Canada.
What is the Environics Institute for Survey Research? Find out by clicking here.
Follow us on other platforms:
Bluesky: @parkinac.bsky.social
Twitter: @Environics_Inst or @parkinac
Instagram and Threads: environics.institute
Photo credit: Mikhail Nilov
Appendix (charts will full time series)2
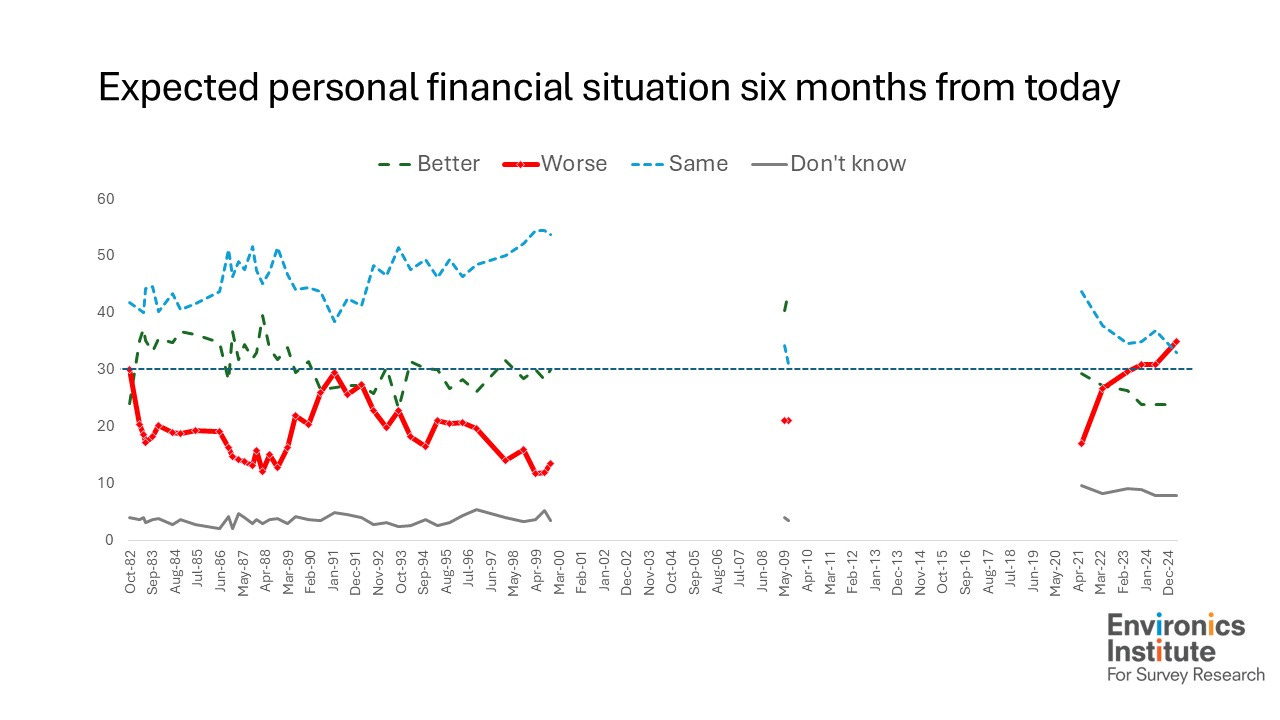
In 1992 the “better” and “worse” figures are the same (27%), though “worse” comes out on top if we go to decimal points.
Note there are two data points in 2009 (from Environics) for the second question.