

“None of the above” is losing support
Three stories about “which government best represents your interests?”

Every year, the Confederation of Tomorrow survey asks Canadians: which government do you believe best represents your interests? I wrote about the results from 2024 here, concluding that the question:
“reveals a lot about the structure of the federation, about regional political cultures, about the political fortunes of different provincial governments and leaders, about left / right political polarization, about generational change in Quebec, and even about the management of the pandemic.”
In other words, it’s a great survey question and it’s always fun to unpack the results province-by-province.
How have opinions on this question changed over the past year – particularly after a change of prime minister and a spring federal election? (Note that the 2025 survey was conducted in May.) The federal government has gained some support – but, in some areas of the country, it appears that developments at the provincial level have made more of a difference.
Here’s the overall trend.1

The proportion of Canadians who see the federal government as their best representative is up five percentage points – either because the new prime minister is more palatable than his predecessor, or because of Ottawa’s response to the challenges emanating from the White House, or both. But the proportion choosing their provincial government has also edged up (by 4 points). This is a modest change at best, but it serves to make the point that things don’t tend to seesaw between the federal and provincial governments; rather, what we see is both governments improving their standing slightly, while the “none of these” response declines.
This pattern is consistent with the findings of one of the earlier reports from the survey, which found that the proportion of Canadians who say that the federal and provincial governments are working well together has gone up, and the proportion trusting neither government to address major issues has gone down.
There is a lesson here for the country’s political leaders. Intergovernmental relations are like advertising in the airline industry. If your pitch to customers is that it’s not safe to fly with your competitor, you’re more likely to turn people off flying altogether than you are to boost your own ticket sales. When first ministers don’t get along, the public is more likely to conclude that the system is not working than they are to pick sides.
So much for the bad analogies. How do results vary across the country?
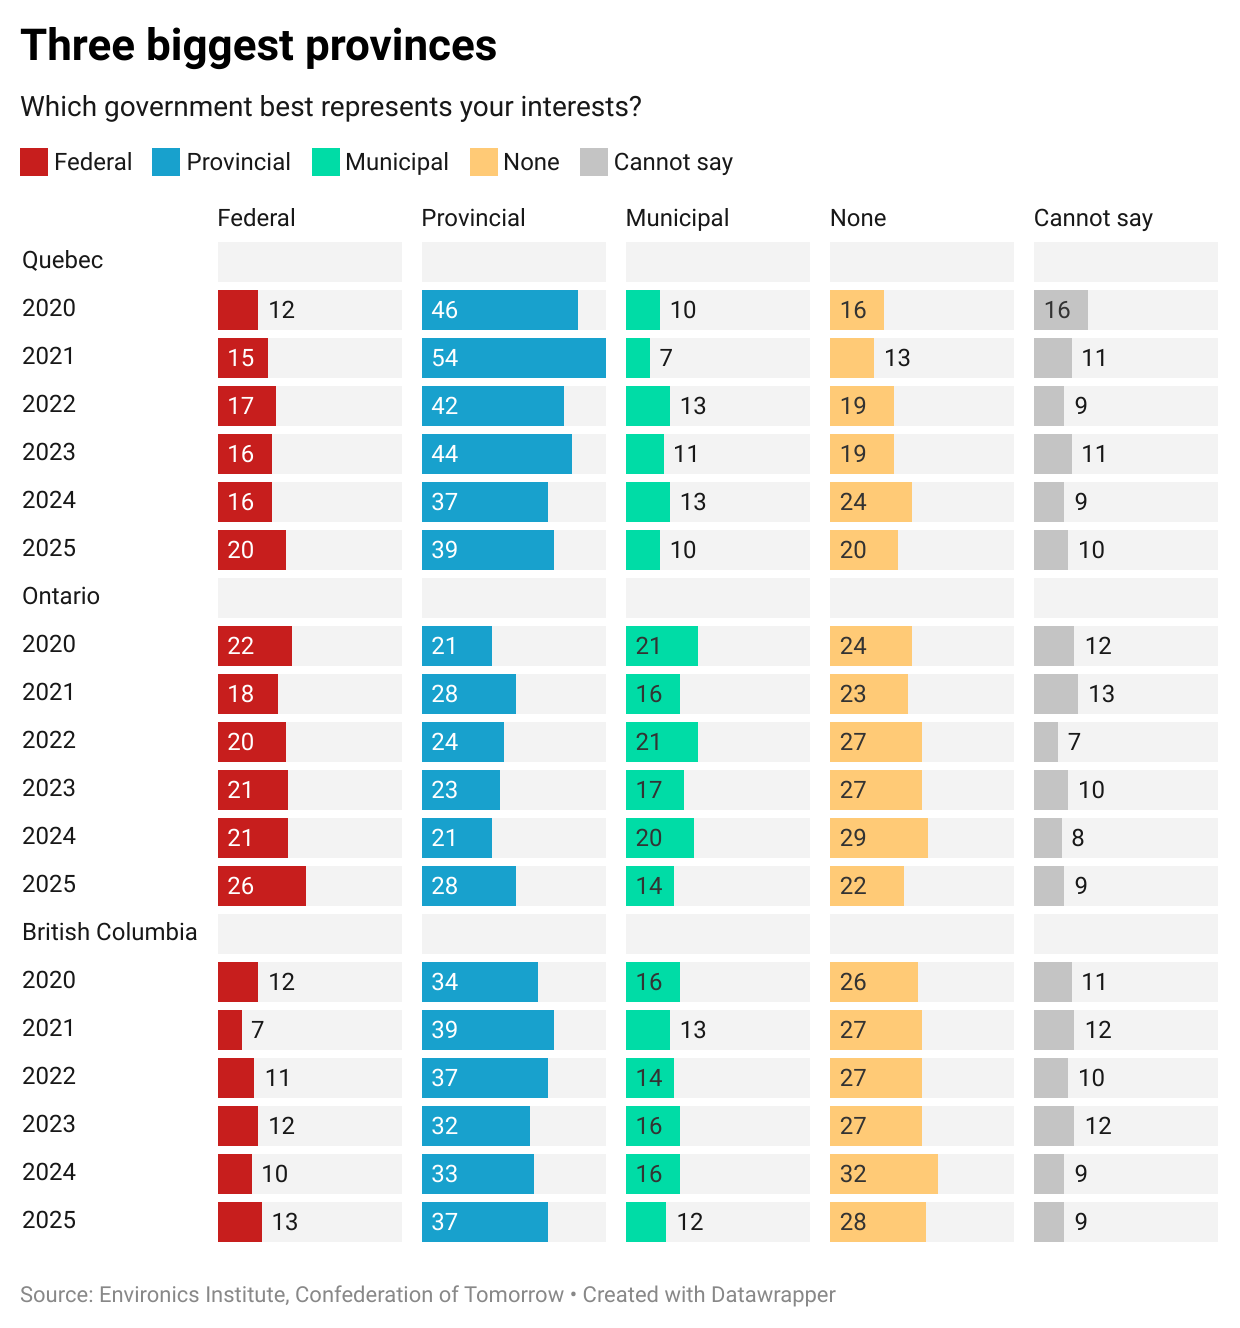
There are actually three distinct stories lurking in this year’s results. The first and least interesting one groups together the three largest provinces: Ontario, Quebec and British Columbia. In each of these provinces, the results mirror the national average: small increases in the proportions choosing both the federal government and their provincial government as their best representative, and concomitant modest drops in the proportion choosing “none of the above.” The chart of results for these provinces is rather boring, so I’m going to add it at the end in an appendix and move on to story number two.
The second story is about Saskatchewan and Alberta. In these two provinces, it looks like the change of prime minister made more of a difference. The proportions choosing the federal government as the best representative is up by nine points in both cases, and the proportions choosing none declined by just a little bit more. It appears that Mark Carney has succeeded in appealing to at least some in these provinces who previously rejected the leadership of both their provincial premiers and of Justin Trudeau.
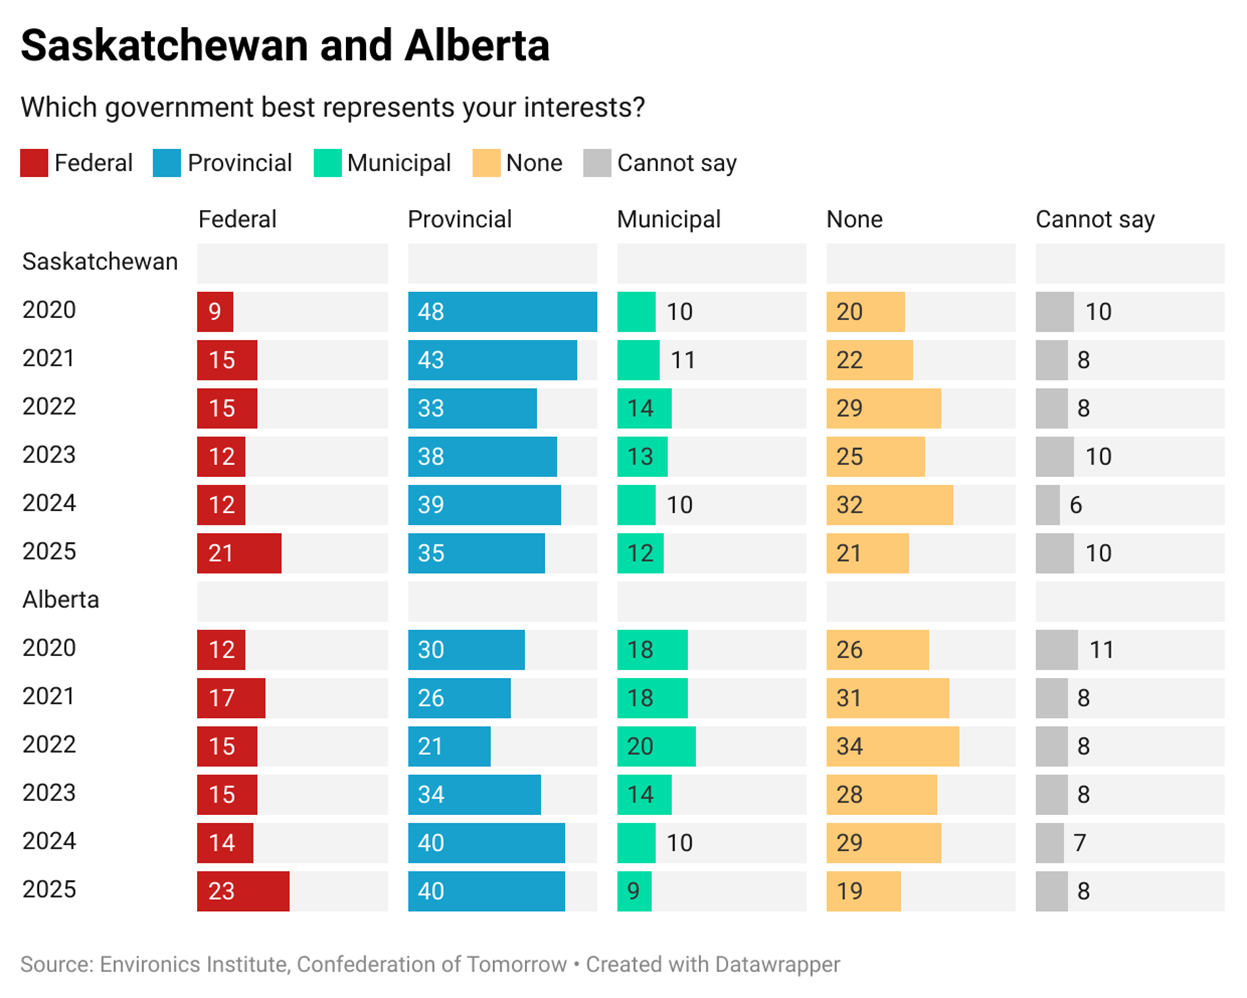
You may have already guessed who these people are: supporters of the provincial NDP. Among people in Saskatchewan or Alberta who would vote for the right-leaning parties in a provincial election (the Saskatchewan Party or the United Conservative Party), the proportion choosing the federal government as their best representative increased from an extremely low three percent in 2024 to a very low seven percent in 2025; meanwhile the proportion saying that no government best represents them dropped by six points, from 20 to 14 percent. For those who would vote NDP, however, the swings are much more dramatic: the proportion choosing the federal government jumped up by 20 points (from 27% to 47%) while the proportion choosing “none of the above” dropped from 39 to 23 percent.

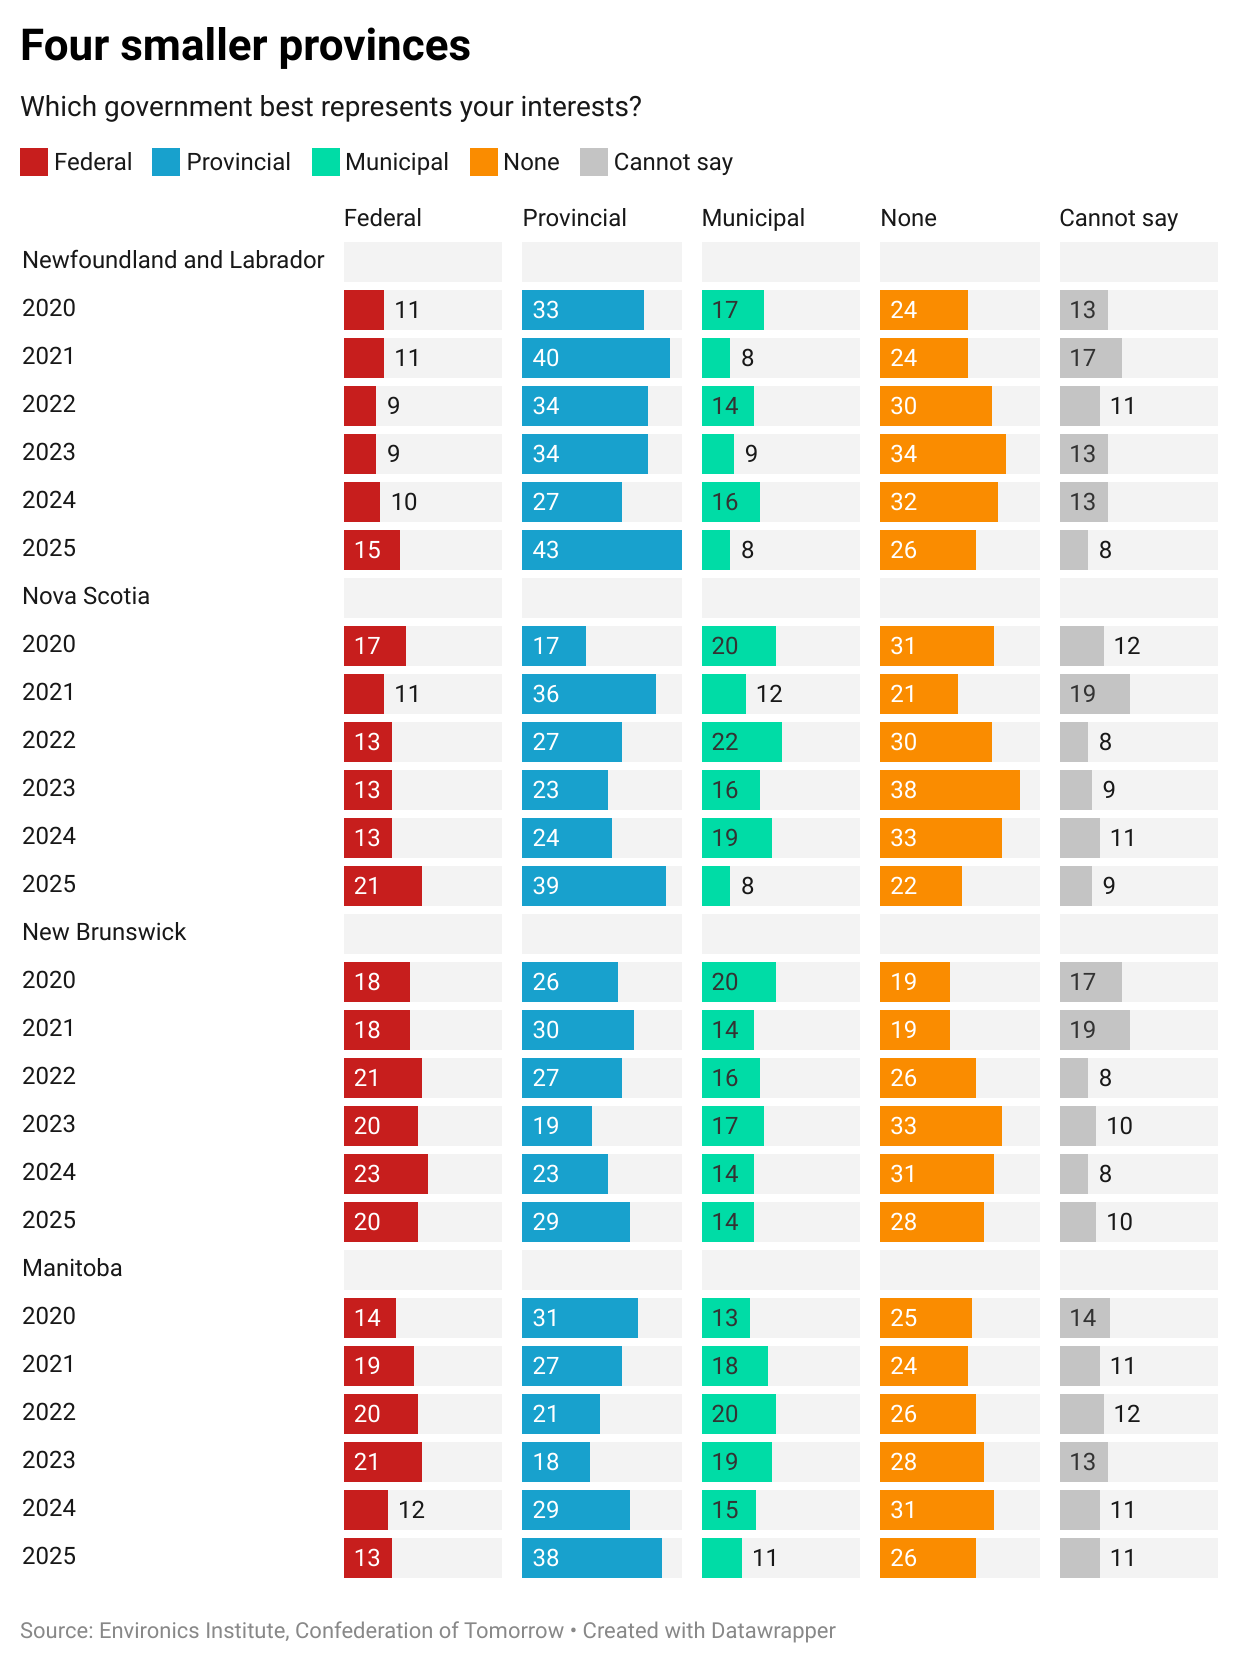
Now on to the third story: in several smaller provinces, new or newly re-elected premiers seem to have improved the standing of the provincial governments they lead. I’m taking the unusual step of grouping Manitoba with a few Atlantic provinces, but this chart should explain why (once again, I’ll add the full results in the appendix).
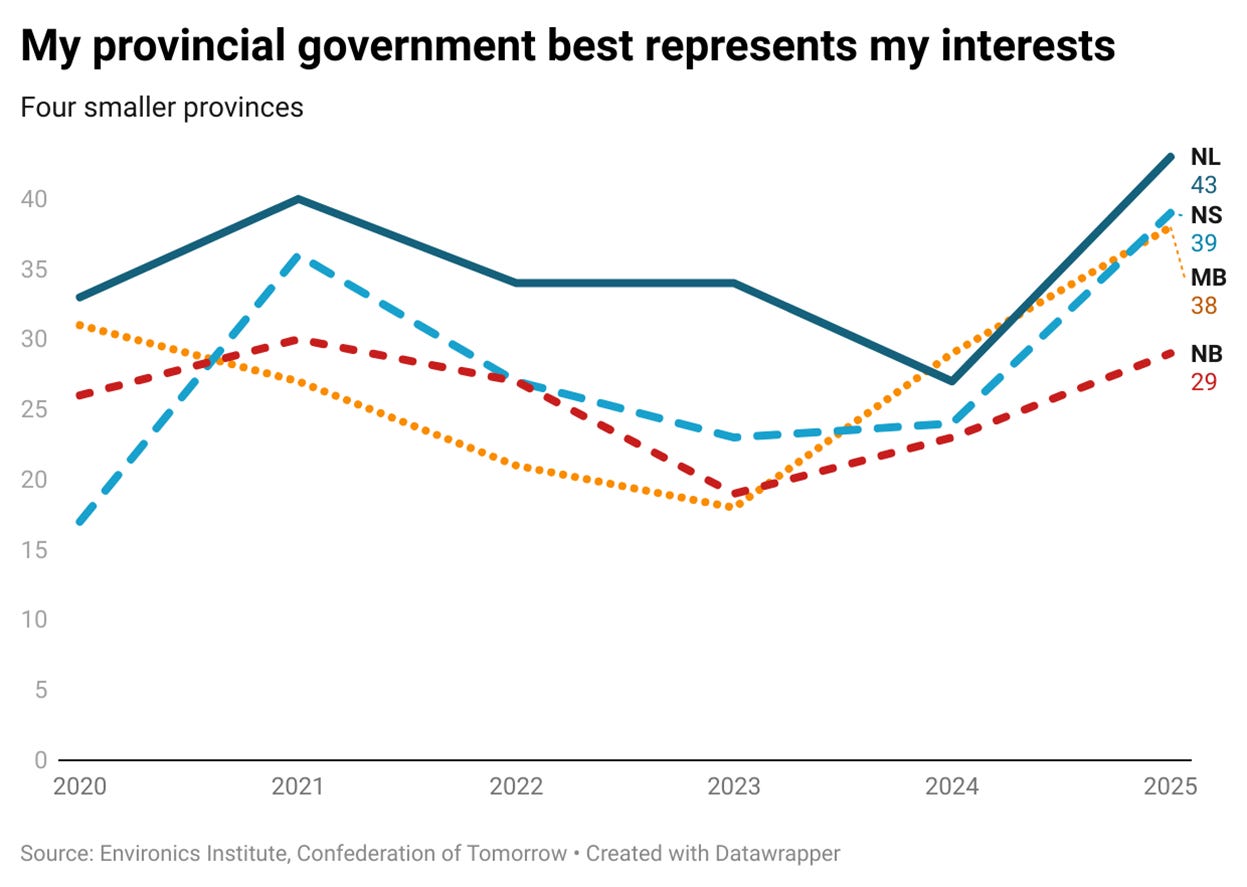
In each of these four provinces, the proportion saying their provincial government best represents their interests has rebounded.
The biggest change since 2024 is in Newfoundland and Labrador, with a 16-percentage point jump. Our survey began in the first days of May, at the exact moment that John Hogan took over his party’s leadership and was sworn in as a new premier. It appears he has made a good first impression.
The proportion of Nova Scotians saying their provincial government best represents them is up 15 points. In this case, Tim Houston is not a new premier, though he was convincingly re-elected in late 2024. Across a range of questions, the 2025 survey points to a better mood in the province this year compared to last; this is only one example.
The change is less sharp in New Brunswick (only a 6-point boost), but it is notable that – in the context of a new premier (Susan Holt) and a new Prime Minister (Carney) – the movement of opinions in the province is in favour of the provincial government.
Finally, there is Manitoba. The swing toward the provincial government as the best representative is up only nine points this year, but that follows an 11-point shift in 2024, the first survey after the election of the NDP with Wab Kinew as leader. In 2023, Manitobans were slightly more likely (by 3 points) to say the federal government best represents their interests than they were to choose the provincial government. In 2025, the gap is 25 points in the other direction.
This last trend warrants an additional chart, because you can bet that not everyone in the province is moving in the same direction.
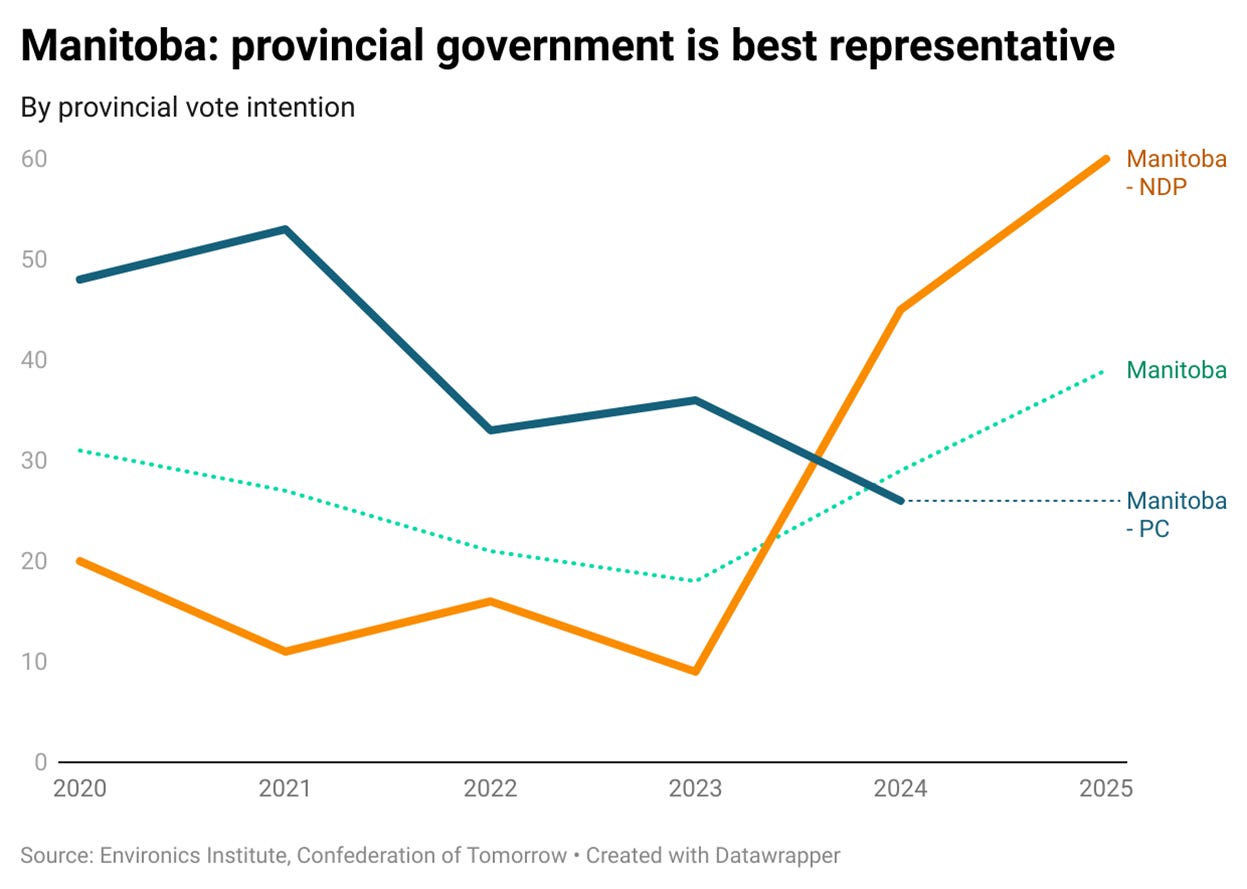
I left out the 2025 result for Progressive Conservative voters in the province, because the subsample for this group has dipped below 100. But, for what it’s worth, their downward movement continues. But it’s the sharp change in opinions for NDP voters that is naturally driving the overall provincial trend.
This leaves Prince Edward Island. I left it out of the third story because it stands as an exception: the arrival of a new premier (Rob Lantz) has not favoured the provincial government. The proportion of Islanders saying their provincial government best represents them dropped by 13 points since 2024, and is down by 25 points since 2022 (see chart in the appendix). The proportion choosing the federal government is up by 14 points over last year. PEI has the smallest provincial sample in the survey (200), so we have to be cautious. What we can say is that the boost for the provincial governments seen in the other three Atlantic provinces does not seem to apply in PEI.
This post features data from the 2025 Confederation of Tomorrow Survey of Canadians. The author is solely responsible for any errors in presentation or interpretation.
The Confederation of Tomorrow surveys give voice to Canadians about the major issues shaping the future of the federation and their political communities. They are conducted annually by an association of the country’s leading public policy and socio-economic research organizations: the Environics Institute for Survey Research, the Centre of Excellence on the Canadian Federation, the Canada West Foundation, the Centre D’Analyse Politique – Constitution et Fédéralisme, the Brian Mulroney Institute of Government and the First Nations Financial Management Board.
The 2025 study consists of a survey of 5,391 adults, conducted between May 1 and June 16, 2025 (92% of the responses were collected between May 6 and May 29); 90% of the responses were collected online. The remaining responses were collected by telephone (both landline and cell phone) from respondents living in the North or on First Nations reserves, or from francophone respondents in New Brunswick.
What is the Environics Institute for Survey Research? Find out by clicking here.
Follow us on other platforms:
Bluesky: @parkinac.bsky.social
Twitter: @Environics_Inst or @parkinac
Instagram and Threads: environics.institute
Photo credit: Towfiqu barbhuiya
Appendix: additional charts

In the survey, respondents who identify as Indigenous have the option of choosing an Indigenous government as the one that best represents them. Nineteen percent of these respondents make this selection; but in the weighted national results, this corresponds to only one percent of the total. For this reason, I don’t show this response in the charts.
https://youtu.be/xtdR4U9rKfo