


Which government best represents your interests?
Look how much fun can you have with a single survey question

This Substack was created, in part, to share survey findings that don’t find their way into our main reports. Here’s one from the 2024 Confederation of Tomorrow survey. Since 2020, we’ve been asking Canadians which government best represents their interests. The findings are always interesting, but this year they just didn’t make it into our reports on issues such as housing or climate change. So, here they are now:

A few initial observations:
First, Canadians are more likely to say their provincial or territorial government best represents their interests than they are to choose the federal or their municipal government. This more or less reflects the purpose and structure of our relatively decentralized federation.
Secondly, there was a modest bump in the proportion choosing their provincial government in the first pandemic-era survey (the one that took place in early 2021) – though, as we’ll see below, this applied to some regions more than others.
And, finally, since then, the proportion saying none of these governments best represents them has been edging upwards – a pattern that matches the main findings from other questions in the survey covered here.
There’s quite a lot of variation in responses across provinces, however. For instance, in 2024, residents of Prince Edward Island, Alberta and Saskatchewan are about twice as likely as Ontarians to say their provincial government best represents them.

Notice that the main trade-off Canadians tend to make is not between the federal and their provincial government; in other words, as the proportion choosing their provincial government as their best representative goes down, the proportion choosing the federal government does not tend to go up – until you get to New Brunswick, near the bottom of the chart.
To illustrate, Manitobans are less likely than Albertans to choose their provincial government as their best representative, but no more likely to choose the federal government – rather, Manitobans are more likely than Albertans to choose their municipal government, or to express no opinion.
Similarly, residents of Nova Scotia are much less likely than residents of PEI to choose their provincial government, but no more likely to choose the federal government; rather, Nova Scotians are more likely to choose their municipal government, or to say that no government best presents them.
The other way of summarizing the pattern is to point to two groups of provinces. At the top are four provinces (PEI, Alberta, Saskatchewan and Quebec) where the proportion choosing their provincial government as the one that best represents them outweighs the proportion saying that no government does. At the bottom are four provinces (Newfoundland and Labrador, Nova Scotia, New Brunswick and Ontario) where the pattern is reversed – the proportion saying “none” outweighs the proportion choosing their provincial government. Nowhere does the federal government come out on top.
I’m belabouring this point, not to beat up on Ottawa, but to emphasize something important about our federation. When we talk about federalism, our main lens is “Ottawa and the provinces” or “federal-provincial relations.” But in terms of who citizens feel speaks for them, that aperture setting may not be wide enough.
Having made that point, let’s look at the recent trends, province by province. This means a lot of charts, but there are times when it’s worth resisting the urge to collapse provinces into regions.

Each of the four Atlantic provinces follows the same general trend: provinces enjoyed a boost in support in 2021, when the region seemed to be escaping the worst of the pandemic. But that proved to be short-lived – and, since then, the proportion selecting “none of these” has increased.
The main reason to look at the four provinces individually, rather than grouped as a region, is to highlight some important distinctions, notably in PEI (with a much higher proportion saying the provincial government is their best representative), and in New Brunswick (the only province other than Ontario where the proportion selecting the federal government matches that selecting the provincial one).
The result in New Brunswick is no fluke – the province also stands out as the one where support for decentralization is weakest, as we reported here.
Next, let’s turn to the Prairies.

Note that there was no pro-province bump in any of the three Prairie provinces in early 2021, as governments tried to cope with the pandemic – an exception to the national trend. This matches other survey findings, reported here, relating to lower than average approval among residents of Manitoba, Saskatchewan and Alberta of their own provincial government’s handling of the pandemic.
Other than that, it’s noticeable that, in both Alberta and Manitoba, the proportion choosing their provincial government as the one that best represents them dips in the middle of the period covered by the survey, before recovering more recently. But you can bet that the political dynamics behind this trend in each of these two provinces are quite different.
As background, in each of the three Prairie provinces, views of this question are quite polarized between those on the political right and those on the left. In Saskatchewan in 2024, for instance, 65 percent of Saskatchewan Party voters say their provincial government best represents them, compared to 15 percent of NDP supporters.
Here’s how the breakdown by party looks in Alberta.
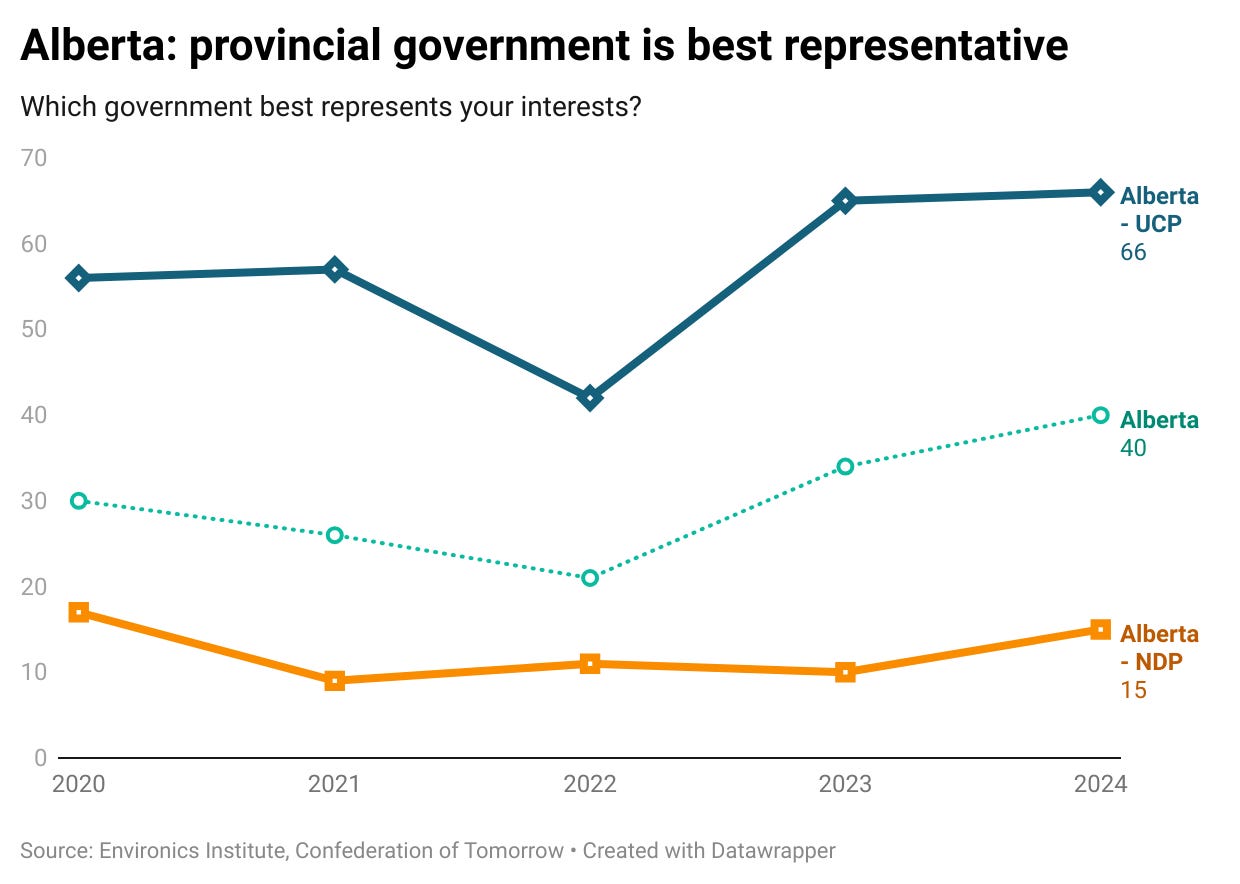
The overall dip in the proportion choosing the provincial government as their best representative was driven by UCP supporters’ rejection of their own leader. The dip was then reversed once Jason Kenney was replaced by Danielle Smith as party leader and premier.
In Manitoba, things look completely different: here’s what happens in the Prairies when you have an election that leads to a change of government. The overall proportion of Manitobans saying their provincial government best represents them was about the same in 2020 (31%) as in 2024 (29%). But the breakdown by provincial vote intention was reversed following the election victory of Wab Kinew’s NDP.

This brings us to the three largest provinces.
Quebec, Ontario and B.C. all follow the national trend (actually, given their demographic weight, it’s more accurate to say they define the national trend): a decline since 2021 in the proportion saying the provincial government is the best representative, and an increase in the proportion saying “none.” But the trend is much more pronounced in Quebec.

Since 2021, the proportion of Quebecers saying their provincial government best represents them has declined by 17 percentage points – a larger drop than in any other province.1 This change not only reflects the recent falling support for the CAQ government registered in the polls, but anticipates it – suggesting that this survey question (about which government you believe best represents your interests) is a useful indicator to watch.

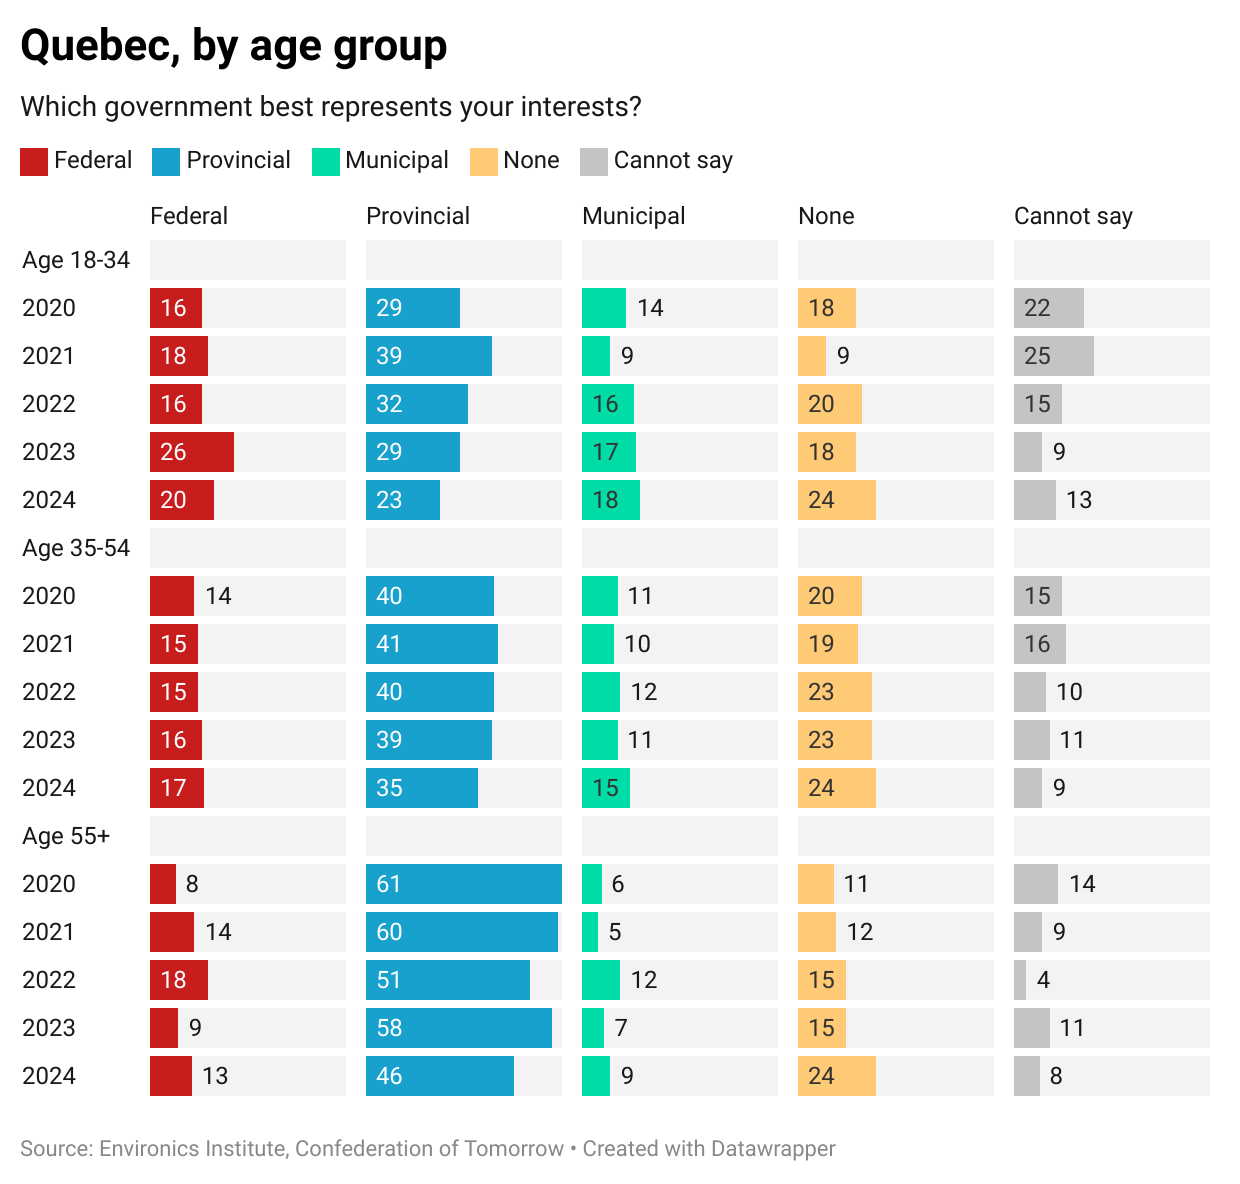
There’s another notable aspect to the Quebec results – the differences among age groups. Younger Quebecers are typically only half as likely as their older counterparts to say their provincial government best represents their interests. This generational difference is consistent across a number of questions about the province and its government: the generation that came of age during (or in the wake of) the Quiet Revolution has a much stronger attachment to the Quebec state than those that came after (more details here).
On this question, this difference among age groups is absent in the rest of the country.

But before federalists get too excited, they should note that – once again – the main trade-off is not between the provincial and federal governments. While younger Quebecers are much less likely to say their provincial government is their best representative, they are not that much more likely to say it’s the federal government.
This completes our tour of the results of only one question from the Confederation of Tomorrow survey. But one question, with five response options, asked over five years in 10 provinces, gives 250 data points – and that’s before we get into age and party breakdowns. It’s a question that reveals a lot about the structure of the federation, about regional political cultures, about the political fortunes of different provincial governments and leaders, about left / right political polarization, about generational change in Quebec, and even about the management of the pandemic.
See how much fun can you have in this country with a single survey question?
This post features data from the 2024 Confederation of Tomorrow Survey of Canadians. The author is solely responsible for any errors in presentation or interpretation.
The Confederation of Tomorrow surveys give voice to Canadians about the major issues shaping the future of the federation and their political communities. They are conducted annually by an association of the country’s leading public policy and socioeconomic research organizations: the Environics Institute for Survey Research, the Centre of Excellence on the Canadian Federation, the Canada West Foundation, the Centre D’Analyse Politique – Constitution et Fédéralisme, the Brian Mulroney Institute of Government and the First Nations Financial Management Board.
The 2024 study consists of a survey of 6,036 adults, conducted between January 13 and April 13, 2024 (82% of the responses were collected between January 17 and February 1); 94% of the responses were collected online. The remaining responses were collected by telephone from respondents living in the North or on First Nations reserves.
It’s arguable that this drop in Quebec is exaggerated because the 2021 result was unusually positive, as the Quebec government enjoyed a bigger early pandemic boost in support. But the decline in Quebec is nonetheless bigger than in the rest of the country (combined), if you compare 2024 either with 2020 (pre-pandemic), or 2023.