

Who wants more government?
Why we shouldn’t assume that younger Canadians are moving to the right

Polls asking who Canadians would vote for in a federal election swung dramatically over the past year, from predicting a thumping majority for the Conservative Party to capturing the resurgent support that returned the Liberal Party to office. This shift was driven by changes in leadership and in circumstances, both of which caused voters to reassess which party was most likely to provide the type of government they wanted.
Most measures are not as volatile as vote intention. The popularity of one party can rise quickly as that of its rival collapses. But this does not usually signal a shift in public support for one approach to government over another.
To illustrate the stability that lay beneath the reversal of political fortunes for the federal Liberal and Conservative parties, let’s take a look at what Canadians say when asked whether they generally prefer larger government (with more services) or smaller government (with fewer services). This is a question we’ve asked 11 times since early 2019.
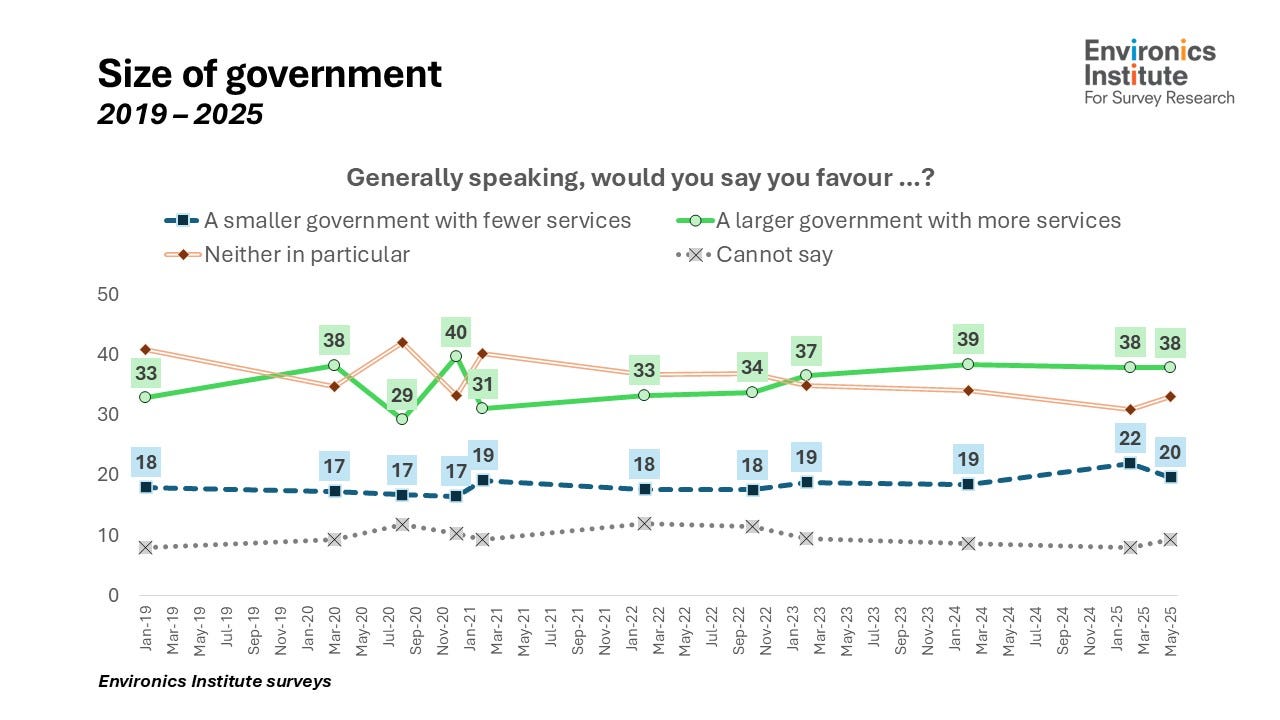
There was some movement in 2020 and 2021, with ups and downs in the proportions preferring larger government or the status quo. This was at the peak of the pandemic, when governments were active with emergency benefits, public health regulations and vaccine procurement. Responses to this question at that time appear to have been particularly context-sensitive.
If we bracket that period, opinions look more stable. Certainly, there’s been little change in the proportion of Canadians who prefer smaller government – this hovers around one in five from 2019 to 2025. The proportion preferring larger government has edged upward over the past few years, from 31 percent in 2021 to 38 percent today. This is a notable, but gradual, change – but, on the whole, opinions are not that different today from where they stood when this series began in 2019.
It's worth dwelling on this for a moment. Between early 2023 and (very) early 2025, support for the Conservative Party grew from about 35 percent to about 45 percent, according to everyone’s favourite poll tracker. But as this shift in party preference was unfolding, preference for smaller government – a core part of what the Conservative Party was offering – hardly moved at all. Had leadership changes in both Canada and the United States not conspired against them, the Conservatives would have taken office with public preference for larger government outweighing that for smaller government by a margin of close to two-to-one.
Let’s look next at how responses break down across the population. To do this, I’m going to simplify the presentation by narrowing things down to the Confederation of Tomorrow surveys, which have included this question six times since 2019 (every year except 2020).
Here’s how the preference for larger government looks by region.
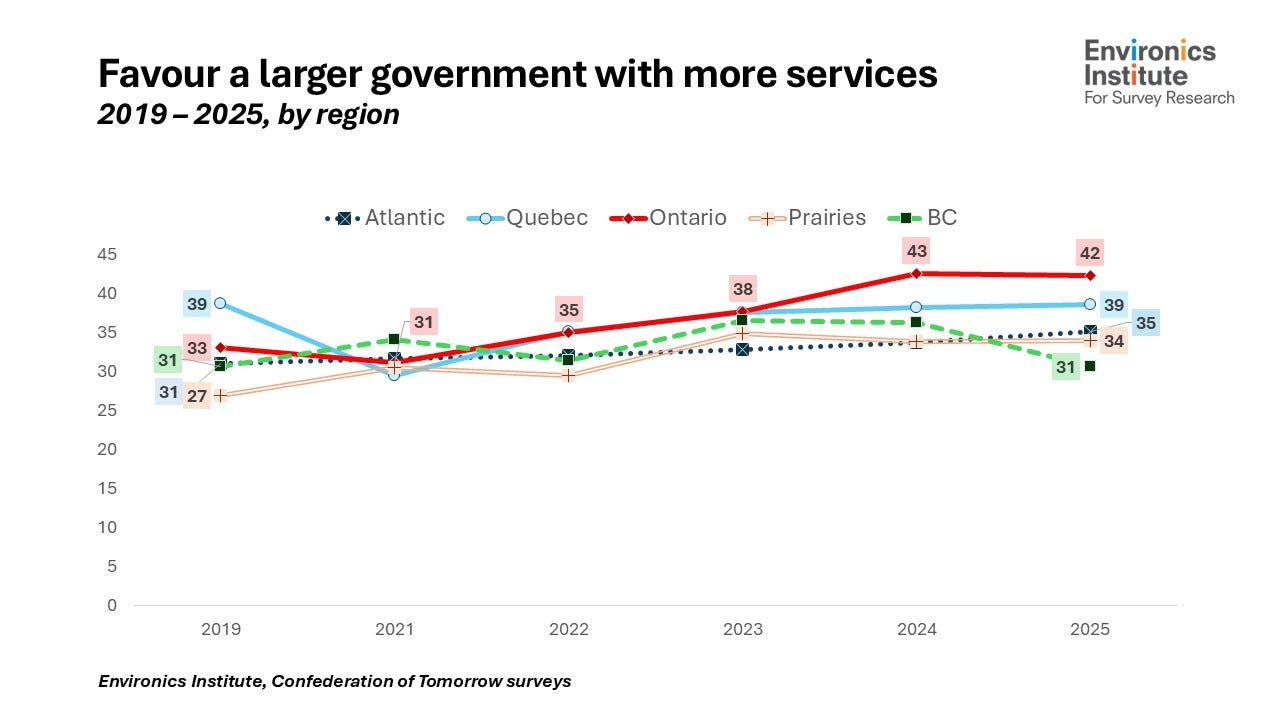
Normally, I wouldn’t publish a chart with lines so squooshed together – I know it’s hard to read – but, this time, this overlap serves to make the point: for much of this period, regional differences are fairly minor.
There’s a bit more differentiation today, but mostly because Ontario has started to pull ahead: between 2021 and 2025, the proportion of Ontarians preferring larger government with more services increased from 31 to 42 percent. This change in Ontario is driving the overall national trend.1
There are differences in opinion on this question by gender: men are about twice as likely as women to favour smaller government (in 2025, the respective proportions are 26% and 14%), while women are slightly more likely to prefer larger government or to express no preference. These differences have been fairly consistent over time (between 2019 and 2025).
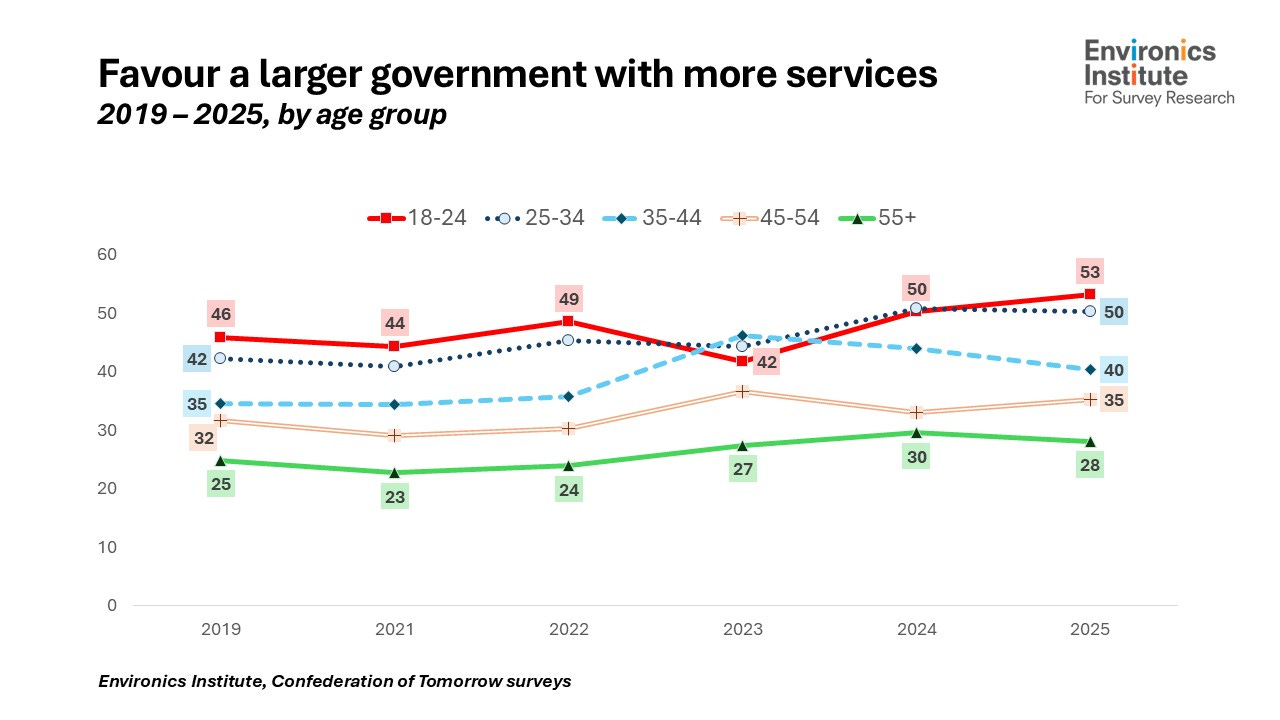
The younger you are, the more likely you are to favour larger government with more services.
There are larger differences by age group. The younger you are, the more likely you are to favour larger government with more services. Older Canadians are more likely to favour neither option (currently, about one in five within each age group favour smaller government with fewer services). And while the preference for larger government is a bit higher today among all age groups than when this series began in 2019, the increase is a little larger among the two youngest groups.
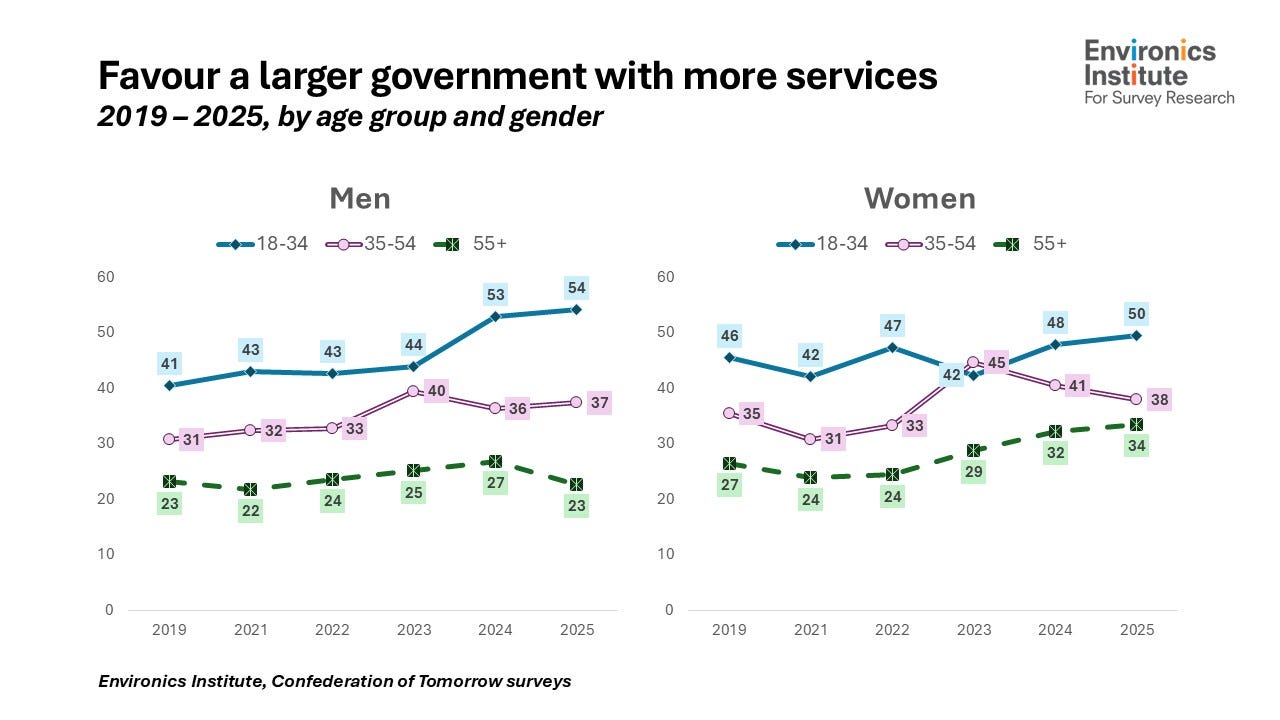
Finally, it’s worth taking a look at how age and gender combine. The patterns are pretty clear. Both younger men and younger women are more likely to favour larger government than their older counterparts. There’s not much of a gap between men and women within the two youngest age groups, but among Canadians age 55 and older, an 11-point gender gap has opened up since 2022. And lastly, it’s just somewhat eye-catching that the group most likely to favour larger government is younger men (with a 13-point increase since the start of this series in 2019).
The fact that younger Canadians (both men and women) are much more likely to favour larger government is interesting when we switch back to thinking about the recent election. We know that younger voters were more preoccupied with the economy and the cost of living than older voters, who tended to be more focused on the threat from the United States (if you missed our recent report on the “ballot questions” in the last election, you can catch up here). This sparked more interest in the Conservative Party among younger voters, with some commentators zeroing in, in particular, on the trend among younger men.
But does this mean that younger Canadians in general, and younger men in particular, are necessarily moving to the right, if we think of that in terms of policy (rather than party) preferences? That’s far from clear. It’s also possible that the signs point in different directions depending on which measure you use – a point worth conceding since this post is based on results to a single question.
It’s a topic I plan to return to a couple of times this autumn.
This post features data from the 2025 Confederation of Tomorrow Survey of Canadians. The author is solely responsible for any errors in presentation or interpretation.
The Confederation of Tomorrow surveys give voice to Canadians about the major issues shaping the future of the federation and their political communities. They are conducted annually by an association of the country’s leading public policy and socio-economic research organizations: the Environics Institute for Survey Research, the Centre of Excellence on the Canadian Federation, the Canada West Foundation, the Centre D’Analyse Politique – Constitution et Fédéralisme, the Brian Mulroney Institute of Government and the First Nations Financial Management Board.
The 2025 study consists of a survey of 5,391 adults, conducted between May 1 and June 16, 2025 (92% of the responses were collected between May 6 and May 29); 90% of the responses were collected online. The remaining responses were collected by telephone (both landline and cell phone) from respondents living in the North or on First Nations reserves, or from francophone respondents in New Brunswick.
What is the Environics Institute for Survey Research? Find out by clicking here.
Follow us on other platforms:
Bluesky: @parkinac.bsky.social
Twitter: @Environics_Inst or @parkinac
Instagram and Threads: environics.institute
Cover photo credit: Hardeep Singh
Some might be surprised that preference for larger government isn’t highest in Quebec or Atlantic Canada. It’s fair to point out that people answer this question in their own contexts; the actual size of government overall (federal and provincial) is larger in some regions than others.
Interesting counter narrative that focusses on policy preferences, not partisan ones.